Transit Forecasting Accuracy Database Analysis
Insights on transit forecasting uncertainty and accuracy, highlighting empirical observations and the development of a database by David Schmitt. The database includes project assumptions, exogenous forecasts, and ridership data for large-scale transit projects, aiming to improve assessment of forecast uncertainty and risk.

Uploaded on Feb 21, 2025 | 0 Views
Download Presentation

Please find below an Image/Link to download the presentation.
The content on the website is provided AS IS for your information and personal use only. It may not be sold, licensed, or shared on other websites without obtaining consent from the author.If you encounter any issues during the download, it is possible that the publisher has removed the file from their server.
You are allowed to download the files provided on this website for personal or commercial use, subject to the condition that they are used lawfully. All files are the property of their respective owners.
The content on the website is provided AS IS for your information and personal use only. It may not be sold, licensed, or shared on other websites without obtaining consent from the author.
E N D
Presentation Transcript
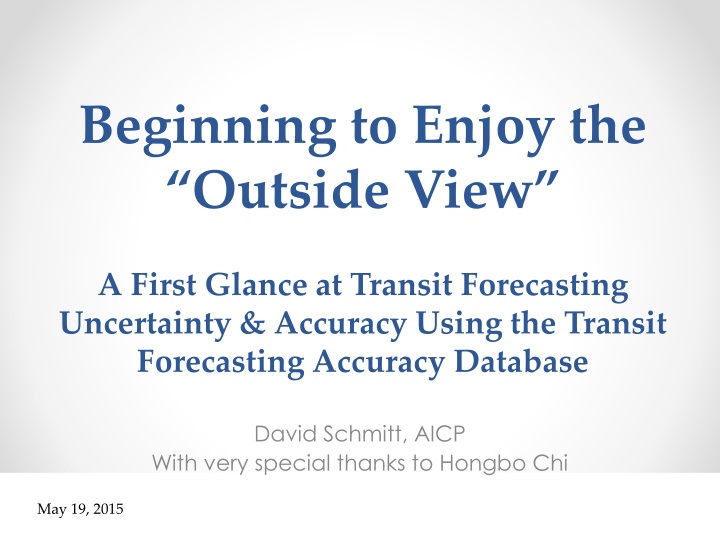
Beginning to Enjoy the Outside View A First Glance at Transit Forecasting Uncertainty & Accuracy Using the Transit Forecasting Accuracy Database David Schmitt, AICP With very special thanks to Hongbo Chi May 19, 2015
Topics The Transit Forecasting Accuracy Database Initial analysis in 3 areas o Project assumptions & exogenous forecasts o Forecast accuracy over time o Determining useful reference classes So what should we be doing differently? Appendix: Materials for application David Schmitt May 19, 2015 Page 2 Enjoying the Outside View
Motivation Empirical observations (by others): o Large inaccuracies in demand from large transit projects (Flyvbjerg, FTA, and others) o Forecasting accuracy for large-scale transportation projects is not improving over time (Flyvbjerg [worldwide] and TRB [USA toll roads]) Empirical observations (by the author): o Assessing uncertainty is not standard practice o Absence of documenting uncertainty & risk in practice o Lack of knowledge about forecast accuracy Given historical inaccuracy, need exists to improve & promote better assessment of forecast uncertainty and risk David Schmitt May 19, 2015 Page 3 Enjoying the Outside View
Transit Forecasting Accuracy Database Developed to report empirical results of project assumptions, exogenous forecasts and ridership forecasts Includes all projects mentioned in Federal Transit Administration's (FTA s) Predicted/Actual and Before/After reports 65 large-scale transit projects o Project description and characteristics (city, length, # stations, CBD/non-CBD, mode) o Tracks differences in forecasted/actual values of 10 project assumptions and exogenous forecasts o Forecasted ridership (year of forecast, forecast year, value) o Observed ridership (year of observation, value) o Allows for multiple records of forecasted and observed ridership David Schmitt May 19, 2015 Page 4 Enjoying the Outside View
Transit Forecasting Accuracy Database: Projects by Mode & Decade of Opening Total Mode 1990s 2000s 2010s 1980s Bus Bus Rapid Transit (BRT) Commuter Rail Streetcar/Trolley Urban Heavy Rail Urban Light Rail Downtown People Mover (DPM) 1 2 1 2 7 1 6 - 4 3 7 1 6% 5% 11% 2% 20% 51% 6% 100% - - - - - - 1 - - - 4 5 2 3 7 1 13 33 4 65 20 1 38 58% 1 - 12 18% 13 20% 2 Total 3% 100% 120 total records of forecasted ridership (mean= 1.8 per project) 218 total records of observed ridership (mean= 3.4 per project) David Schmitt May 19, 2015 Page 5 Enjoying the Outside View
Project Assumptions & Exogenous Forecasts Examples: o Project characteristics (level of service, travel time, fare) o Transit system (supporting and competing networks) o Roadway system (level of congestion) o Demographics (population, employment estimates) o External conditions (economic, auto fuel prices) Provided to transit forecasters, and typically accepted without review Are these assumptions and forecasts biased? If they are biased, how should transit forecasters present the impact of these assumptions/forecasts? David Schmitt May 19, 2015 Page 6 Enjoying the Outside View
Historical (In)Accuracy of Project Assumptions & Exogenous Forecasts Filled cells represent highest proportion of each row Significant optimism bias in assumptions & forecasts, which increases risk of ridership forecasting inaccuracy Recommendations: -Forecasters should not assume accuracy of project assumptions -Forecasters should not absorb inaccuracy of project assumptions -Forecasters need to perform an analysis of the uncertainties, demonstrating the impact of ridership forecast variability David Schmitt May 19, 2015 Page 7 Enjoying the Outside View
David Schmitt May 19, 2015 Page 8 Enjoying the Outside View
Reference Class Forecasting The use of base-rate and distributional results derived from similar past situations and their outcomes ( outside view ) to de- bias forecasts made using traditional methods The American Planning Association recommended it s use in 2005 Empirical observations: o Absence of reference class forecasting in USA practice o Absence of reference classes focused on USA transit Objective: Determine appropriate reference classes for USA transit ridership forecasting David Schmitt May 19, 2015 Page 9 Enjoying the Outside View
Determining Appropriate Reference Classes: Experiment Design Ascertain statistically significant differences in average accuracy for 4 potential reference groups For each project: o Forecast Ridership: use most recent forecast made prior to construction o Observed Ridership: use observation closest to forecast year o Example: A 2009 forecast is compared to 2010 observed ridership, the earliest recorded observation after project opening Accuracy: actual / forecasted ridership o 0.00-0.99, forecasted > actual ridership (over-forecast) o = 1.00, forecasted matches actual ridership o 1.01+, forecasted < actual ridership (under-forecast) For all projects in database: David Schmitt May 19, 2015 Page 10 Enjoying the Outside View
Reference Class Groups Hypothesis Result More recent projects (2007- present) are, on average, more accurate than less recent projects (2000-2006) More recent projects are more accurate and more appropriate reference class 1 Time Period Tested Downtown People Movers (DPM), Bus/BRT, Light Rail, Heavy Rail, & Commuter Rail Light rail (better) and DPMs (worse) projects have statistically significant differences in average accuracy 2 Mode Forecasts are more accurate in later stages of project development: Planning Engineering Full Funding Grant Agreement 3 Project Development Phase No statistically significant difference in forecast accuracy between any two project phases Smaller changes to transit system are easier to predict (more accurate) than larger changes: 1st rail mode (largest) new line extension (smallest) No statistically significant difference between projects with small or large changes 4 Impact to Transit System David Schmitt May 19, 2015 Page 11 Transit Forecasting Accuracy Database: Enjoying the Outside View
Reference Class Recommendations Reference Class Conditions for Application Travel model properties have been thoroughly reviewed Projects constructed since 2007 LRT projects only Project mode is LRT If the conditions for other two classes cannot be met All projects Reference Class Reports and corresponding Project Assumption Accuracy Reports can be found in the Appendix to this presentation David Schmitt May 19, 2015 Page 12 Enjoying the Outside View
Conclusions Project assumptions have historical bias towards over-forecasting ridership Project assumptions are forecasts also and should be treated as such by transit forecasters Transit forecasts, on average, are biased but have been (slowly and non-monotonically) getting more accurate Three reference classes are appropriate for USA transit ridership forecasting David Schmitt May 19, 2015 Page 13 Enjoying the Outside View
So What Should We Be Doing? Review all project assumptions for reasonableness before accepting them into ridership forecasts Improve the description of uncertainty & risk in ridership forecasts: o Perform Uncertainty Analyses of project assumptions using historical ranges of variability o Utilize Reference Class Forecasting techniques using most appropriate reference class o Document forecasts fully, including all project assumptions & exogenous forecasts David Schmitt May 19, 2015 Page 14 Enjoying the Outside View
Freely-Available Materials for Application (See Appendix to this Presentation) Item Available Materials Project Assumption Accuracy Report for each reference class: Empirical accuracy for each project assumption Uncertainty Analyses Reference Class Reports for each reference class: (a) Cumulative distribution function Reference Classes (b) Accuracy mean, median, std dev and variance David Schmitt May 19, 2015 Page 15 Enjoying the Outside View
Final Comments Updated Uncertainty Analysis and Reference Class Reports will be made publicly-available on a regular basis (through TMIP listserv or similar service) To contribute/assist with projects not currently in the database, please contact David Schmitt (daves1997@gmail.com) David Schmitt May 19, 2015 Page 16 Enjoying the Outside View
Thank you! David Schmitt, AICP daves1997@gmail.com David Schmitt May 19, 2015 Page 17 Enjoying the Outside View
References 1. 2. Flyvbjerg, Bent. From Nobel Prize to Project Management: Getting Risks Right. Project Management Journal. August 2006. Flyvbjerg, Bent. How (In)accurate Are Demand Forecasts in Public Works Projects?: The Case of Transportation. Journal of American Planning Association. Vol. 71, No. 2. Spring 2005. Flyvbjerg, Bent. Quality Control and Due Diligence in Project Management: Getting Decisions Right By Taking the Outside View. International Journal of Project Management. 2012. Kahneman, Daniel and Amos Tversky. Intuitive Prediction: Biases and Corrective Procedures. Decision Research. June 1977. Nicolaisen, Morten Skou and Patrick Arthur Driscoll. Ex-Post Evaluations of Demand Forecast Accuracy: A Literature Review. Transport Reviews. Vol. 34, No. 4, pp. 540-557. 2014. Taleb, Nassim Nicholas. Antifragile: Things That Gain from Disorder. Random House, 2012-11-27. iBooks. Taleb, Nassim Nicholas. The Black Swan: Second Edition. Random House Trade Paperbacks, 2010-05-11. iBooks. Transportation Research Board. National Cooperative Highway Research Program Synthesis 364: Estimating Toll Road Demand and Revenue A Synthesis of Highway Practice. 2006. U.K. Department of Transport. Procedures for Dealing with Optimism Bias in Transport Planning: Guidance Document. June 2004. U.S. Department of Transportation: Federal Transit Administration. Before-and-After Studies of New Starts Projects [annual reports to Congress]. 2007-2013. U.S. Department of Transportation: Federal Transit Administration. Predicted and Actual Impacts of New Starts Projects: Capital Cost, Operating Cost and Ridership Data. September 2003. U.S. Department of Transportation: Federal Transit Administration. The Predicted and Actual Impacts of New Starts Projects - 2007: Capital Cost and Ridership. April 2008. U.S. Department of Transportation: Transportation Systems Center. Urban Rail Transit Projects: Forecast Versus Actual Ridership and Costs. October 1989. U.S. Department of Transportation: Federal Transit Administration. Travel Forecasting for New Starts: A Workshop Sponsored by the Federal Transit Administration. Phoenix and Tampa, 2009. U.S. Department of Transportation: Travel Model Improvement Program Webinar: Shining a Light Inside the Black Box (Webinar I). February 14, 2008. Wachs, Martin. Ethics and Advocacy in Forecasting for Public Policy . Business & Professional Ethics Journal, Vol. 9, Nos. 1 & 2. Web site: https://www.planning.org/newsreleases/2005/apr07.htm. Accessed December 2014. Web site: http://www.homereserve.com/images/Classic_room.jpg. Accessed January 2015. Web site: http://static3.businessinsider.com/image/4e020c7cccd1d5c239010000-1200/23-back-bay-in-boston-ma.jpg.. Accessed January 2015. Wikipedia. http://en.wikipedia.org/wiki/Reference_class_forecasting. Accessed February 2015. 3. 4. 5. 6. 7. 8. 9. 10. 11. 12. 13. 14. 15. 16. 17. 18. 19. 20. David Schmitt May 19, 2015 Page 18 Enjoying the Outside View
Appendix: Uncertainty Analysis & Reference Class Resources Application Resources David Schmitt May 19, 2015 Page 19 Enjoying the Outside View
Uncertainty Analysis & Reference Class Forecasting: Application Resources Topic Resource U.S. Department of Transportation: Federal Transit Administration. Travel Forecasting for New Starts: A Workshop Sponsored by the Federal Transit Administration. Phoenix and Tampa, 2009. Uncertainty Analysis (discussion and example) Flyvbjerg, Bent. From Nobel Prize to Project Management: Getting Risks Right. Project Management Journal. August 2006. Describes reference class process & provides information to mitigate optimism bias for rail capital cost overruns Kahneman, Daniel and Amos Tversky. Intuitive Prediction: Biases and Corrective Procedures. Decision Research. June 1977. Flyvbjerg, Bent. Quality Control and Due Diligence in Project Management: Getting Decisions Right By Taking the Outside View. International Journal of Project Management. 2012. Details a due diligence forecast review Specific procedures on reference classing, benchmarking, and managing bias U.K. Department of Transport. Procedures for Dealing with Optimism Bias in Transport Planning: Guidance Document. June 2004. Bain, Robert. Error and Optimism Bias in Toll Road Traffic Forecasts. Springer Science+Business Media, LLC. 2009. Procedures for mitigating risks of toll roadway project forecasts Department of Infrastructure and Transport. An Investigation of the Causes of Over-Optimistic Patronage Forecasts for Selected Recent Toll Road Projects (Revised Final Report). 2011. David Schmitt May 19, 2015 Page 20 Enjoying the Outside View
Appendix: Project Assumption Accuracy & Reference Class Reports Application Resources David Schmitt May 19, 2015 Page 21 Enjoying the Outside View
Reference Class #1 Projects constructed since 2007 Conditions for Application: Travel model properties thoroughly reviewed David Schmitt May 19, 2015 Page 22 Enjoying the Outside View
Project Assumption Accuracy Report for Uncertainty Analyses (n=12) Actual Levels Are Well Above Assumed Levels 9% 0% 0% 13% 17% 0% 25% 0% 33% 0% Well Below Assumed Levels Below Assumed Levels Above Assumed Levels Characteristic At Assumed Levels N Supporting transit network Project Service Levels Economic Conditions Competing transit network Employment Estimates Project Travel Time Project Fare Population Estimates Auto Fuel Price Roadway congestion 11 11 9 8 6 5 4 4 3 2 9% 18% 33% 0% 0% 0% 0% 0% 0% 50% 36% 36% 56% 13% 67% 40% 0% 75% 0% 50% 45% 36% 0% 38% 0% 60% 50% 0% 0% 0% 0% 9% 11% 38% 17% 0% 25% 25% 67% 0% David Schmitt May 19, 2015 Page 23 Enjoying the Outside View
Mean = 0.85 Median = 0.83 Std. Dev = 0.22 Variance = 0.05 David Schmitt May 19, 2015 Page 24 Enjoying the Outside View
Reference Class #2 Light Rail Transit (LRT) Projects Conditions for Application: Project mode is LRT David Schmitt May 19, 2015 Page 25 Enjoying the Outside View
Project Assumption Accuracy Report for Uncertainty Analyses (n=33) David Schmitt May 19, 2015 Page 26 Enjoying the Outside View
Mean = 0.76 Median = 0.72 Std. Dev = 0.32 Variance = 0.10 David Schmitt May 19, 2015 Page 27 Enjoying the Outside View
Reference Class #3 All Projects Conditions for Application: If the conditions for other two classes cannot be met David Schmitt May 19, 2015 Page 28 Enjoying the Outside View
Project Assumption Accuracy Report for Uncertainty Analyses (n=61) David Schmitt May 19, 2015 Page 29 Enjoying the Outside View
Mean = 0.63 Median = 0.64 Std. Dev = 0.32 Variance = 0.10 David Schmitt May 19, 2015 Page 30 Enjoying the Outside View


Accuracy of")