Transition Stakeholder Meeting: Parent Information Center

Matusevich, Education Associate, discusses secondary and transition services at the Delaware Department of Education. The indicators focus on graduation rates for youth with IEPs, analyzing data from previous years to evaluate progress towards goals

Download Presentation

Please find below an Image/Link to download the presentation.
The content on the website is provided AS IS for your information and personal use only. It may not be sold, licensed, or shared on other websites without obtaining consent from the author.If you encounter any issues during the download, it is possible that the publisher has removed the file from their server.
You are allowed to download the files provided on this website for personal or commercial use, subject to the condition that they are used lawfully. All files are the property of their respective owners.
The content on the website is provided AS IS for your information and personal use only. It may not be sold, licensed, or shared on other websites without obtaining consent from the author.
E N D
Presentation Transcript
Transition Stakeholder Meeting Parent Information Center Dale Matusevich Education Associate, Secondary and Transition Services Delaware Department of Education November 2, 2021
Indicator 1 Indicator 1 - - Graduation Graduation Description: Youth with IEPs graduating high school with a regular diploma. Regulation: 20 U.S.C. 1415(a)(3)(A) Measurement: States must report a percentage using the number of youth with IEPs (ages 14-21) who exited special education due to graduating with a regular high school diploma in the numerator and the number of all youth with IEPs who left high school (ages 14-21) in the denominator. Data for this indicator are lag data. Describe the results of the State s examination of the data for the year before the reporting year (e.g., for the FFY 2020 SPP/APR, use data from 2019-2020), and compare the results to the target. The following exiting categories are included in the denominator: (a) graduated with a regular high school diploma; (b) graduated with a state-defined alternate diploma; (c) received a certificate; (d) reached maximum age; or (e) dropped out. The following exiting categories are not included in the denominator the number of youths with IEPs who exited special education due to: (a) transferring to regular education; or (b) who moved but are known to be continuing in an educational program.
Indicator 1 Indicator 1 - - Graduation Graduation Description: Youth with IEPs graduating high school with a regular diploma. Regulation: 20 U.S.C. 1415(a)(3)(A) Measurement & Calculation: Youth with IEPs (ages 14-21) who exit HS with Regular Diploma All youth with IEPs (ages 14-21) who exit HS with Regular Diploma, Alternate Diploma, who age out, or Drop out
Indicator 1 Indicator 1 - - Graduation Graduation Data Source and Outcomes: Federal Fiscal Year 2013 2014 2015 2016 2017 2018 2019 Number of youth with IEPs in the year s adjusted cohort graduating with a regular diploma: 919 839 695 682 766 941 1,086 Number of youth with IEPs in the year s adjusted cohort eligible to graduate: 1,116 1,007 886 929 994 1,214 1,393 Percent of youth with IEPs in the year s adjusted cohort graduating with a regular diploma: 82.3% 83.3% 78.4% 73.4% 77.1% 77.5% 78.0% 63.7% 66.7% 71.4% 74.1% 77.8% 67.3% 68.5% Year target: Note: Data for this indicator are lag data. Describe the results of the State s examination of the data for the year before the reporting year (e.g., for the FFY 2020 SPP/APR, use data from 2019-2020), and compare the results to the target.
Indicator 2 Indicator 2 - - Dropout Dropout Description: Youth with IEPs dropping out of high school. Regulation: 20 U.S.C. 1415(a)(3)(A) Measurement: States must report a percentage using the number of youth with IEPs (ages 14- 21) who exited special education due to dropping out in the numerator and the number of all youth with IEPs who left high school (ages 14-21) in the denominator. Data for this indicator are lag data. Describe the results of the State s examination of the data for the year before the reporting year (e.g., for the FFY 2020 SPP/APR, use data from 2019-2020), and compare the results to the target. The following exiting categories are included in the denominator the following exiting categories: (a) graduated with a regular high school diploma; (b) received a certificate; (c) reached maximum age; (d) dropped out; or (e) died. The following exiting categories are not included in the denominator the number of youths with IEPs who exited special education due to: (a) transferring to regular education; or (b) who moved, but are known to be continuing in an educational program.
Indicator 2 Indicator 2 - - Dropout Dropout Description: Youth with IEPs dropping out of high school. Regulation: 20 U.S.C. 1415(a)(3)(A) Measurement & Calculation: All Students with IEPs (ages 14-21) who exited school due to dropping out All Students with IEPs (ages 14-21) who exited school with regular/alternate diploma, who aged out, or dropped out
Indicator 2 Indicator 2 - - Dropout Dropout Data Source and Outcomes: Federal Fiscal Year 2013 2014 2015 2016 2017 2018 2019 Number of youth with IEPs (ages 14- 21) who exited school under the criteria for dropping out: 141 121 112 174 171 147 163 Number of youth with IEPs (ages 14- 21) who exited high school: 1,116 1,007 886 929 994 1,214 1,393 Percent of youth with IEPs (ages 14- 21) who left high school by dropping out: 12.6% 12.0% 12.6% 18.7% 17.2% 12.1% 11.7% 5.1% 5.2% 4.9% 4.6% 4.3% 4.0% 3.7% Year target: Note: Data for this indicator are lag data. Describe the results of the State s examination of the data for the year before the reporting year (e.g., for the FFY 2020 SPP/APR, use data from 2019-2020), and compare the results to the target.
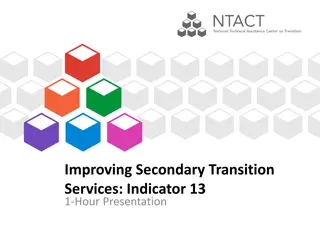
Indicator 13 Indicator 13 Transition Planning Transition Planning Description Percent of youth with IEPs aged 14 and above or in the 8th grade with an IEP that includes appropriate measurable postsecondary goals that are : Annually updated and Based upon an age appropriate transition assessment, Transition services, including courses of study, that will reasonably enable the student to meet those postsecondary goals, and Annual IEP goals related to the student s transition services needs. Regulation: 20 U.S.C. 1415(a)(3)(B)
Indicator 13 Indicator 13 Transition Planning Transition Planning Federal Fiscal Year 2013 2014 2015 2016 2017 2018 2019 Number of youth aged 14 and above with IEPs that contain each of the required components for secondary transition: 77 6,820 7,700 7,675 8,514 8,034 9,304 Number of youth with IEPs aged 14 and above: 159 6,949 7,760 7,734 8,514 8,318 9,314 Percent of youth aged 14 and above or in the 8th grade with IEPs that contain each of the required components for secondary transition: 48.4% 98.1% 99.2% 99.2% 100.0% 96.6% 99.9%
Indicator Indicator 14 14 Post Post- -School Outcomes School Outcomes Description: Youth who are who are no longer in secondary school, had IEPs in effect at the time they left school and were A. Enrolled in higher education within 1 year of leaving high school B. Enrolled in higher education or competitively employed within 1 year of leaving high school C. Enrolled in higher education or in some other postsecondary education or training program, competitively employed or in some other employment within 1 year of leaving high school. Regulation: 20 U.S.C 1415(a)(3)(B)
Indicator 14 Indicator 14 Post School Outcomes Post School Outcomes Measure A: Higher Education Measure A: Higher Education Description: Youth who are who are no longer in secondary school, had IEPs in effect at the time they left school and were A. Enrolled in higher education within 1 year of leaving high school Measurement: Percent enrolled in higher education = (Measure A) enrolled on a full-or part-time basis in a community college (two year program) or college/university (four or more year program) for at least one complete term, at any time in the year since leaving high school. Federal Fiscal Year 2013 2014 2015 2016 2017 2018 2019 Number of youth with IEPs in effect at the time they left school: 390 455 347 471 732 616 674 14A Number of youth with IEPs in effect at the time they left school who enrolled in higher education within one year of leaving high school: 77 286 219 233 303 281 360 14A Percent of youth with IEPs in effect at the time they left school who enrolled in higher education within one year of leaving high school: 20% 63% 63% 49% 41% 46% 53% 14A Year target: 21.0% 25.0% 29.0% 33.0% 37.0% 41.0% 45.0%
Indicator 14 Indicator 14 Post School Outcomes Post School Outcomes Measure B: Higher Education and Measure B: Higher Education and Competitive Integrated Employment Competitive Integrated Employment Description: Youth who are who are no longer in secondary school, had IEPs in effect at the time they left school and were: B. Enrolled in higher education or competitively employed within 1 year of leaving high school Measurement: Percent enrolled in higher education or competitively employed within one year of leaving high school = (Measure A + B) competitive integrated employment maintaining the standard of 20 hours a week, at or above minimum wage, and for at least 90 days at any time in the year since leaving high school. This definition applies to military employment. Federal Fiscal Year 2013 2014 2015 2016 2017 2018 2019 Number of youth with IEPs in effect at the time they left school: 390 455 347 471 732 616 674 14B Number of youth with IEPs in effect at the time they left school who enrolled in higher education or were competitively employed within one year of leaving high school: 205 358 282 389 455 453 495 14B Percent of youth with IEPs in effect at the time they left school who enrolled in higher education or were competitively employed within one year of leaving high school: 53% 79% 81% 83% 62% 74% 73% 52.0% 56.0% 60.0% 64.0% 68.0% 72.0% 76.0% 14B Year target:
Indicator 14 Indicator 14 Post School Outcomes Post School Outcomes Measure C: All Categories Measure C: All Categories Description: Youth who are who are no longer in secondary school, had IEPs in effect at the time they left school and were C. Enrolled in higher education or in some other postsecondary education or training program, competitively employed or in some other employment within 1 year of leaving high school. Measurement: A + B + C Federal Fiscal Year 2013 2014 2015 2016 2017 2018 2019 Number of youth with IEPs in effect at the time they left school: 390 455 347 471 732 616 674 14C Number of youth with IEPs in effect at the time they left school who enrolled in higher Education or in some other postsecondary Education or training program or were competitively employed or in some other employment within one year of leaving high school: 256 376 298 406 597 499 591 14C Percent of youth with IEPs in effect at the time they left school who enrolled in higher Education or in someother postsecondaryEducation or training program or werecompetitively employed or in some otheremployment within one year of leaving high school: 66% 83% 86% 86% 82% 81% 88% 14C Year target: 100.0% 100.0% 100.0% 100.0% 100.0% 100.0% 100.0% *Enrolled in other postsecondary education or training means youth have been enrolled on a full or part-time basis for at least 1 complete term at any time in the year since leaving high school in an education or training program (e.g., Job Corps, adult education, workforce development program, vocational technical school which is less than a two year program). Engaged in some other employment means youth have worked for pay (less than 20 hours a week) or been self-employed for a period of at least 90 days at any time in the year since leaving high school. This includes working in a family business (e.g., farm, store, fishing, ranching, catering services, etc.).
FEEDBACK WHAT S WORKING AND SUGGESTIONS FOR IMPROVEMENT 14
Lets Talk Let s Talk Feedback/Input What strategies do you feel have been working? What strategies do you feel could be implemented to improve graduation rates?
FEEDBACK TARGET SETTING 16
Indicator 1 Indicator 1 - - Graduation Graduation Target Setting Feedback: What do you feel should be the annual percentage increase for target setting? Data Source and Outcomes: Federal Fiscal Year 2013 2014 2015 2016 2017 2018 2019 Number of youth with IEPs in the year s adjusted cohort graduating with a regular diploma: 919 839 695 682 766 941 1,086 Number of youth with IEPs in the year s adjusted cohort eligible to graduate: 1,116 1,007 886 929 994 1,214 1,393 Percent of youth with IEPs in the year s adjusted cohort graduating with a regular diploma: 82.3% 83.3% 78.4% 73.4% 77.1% 77.5% 78.0% 63.7% 66.7% 71.4% 74.1% 77.8% 67.3% 68.5% Year target: Note: Data for this indicator are lag data. Describe the results of the State s examination of the data for the year before the reporting year (e.g., for the FFY 2020 SPP/APR, use data from 2019-2020), and compare the results to the target.
Indicator 2 Indicator 2 - - Dropout Dropout Target Setting Feedback: What do you feel should be the annual percentage increase for target setting? Data Source and Outcomes: Federal Fiscal Year 2013 2014 2015 2016 2017 2018 2019 Number of youth with IEPs (ages 14- 21) who exited school under the criteria for dropping out: 141 121 112 174 171 147 163 Number of youth with IEPs (ages 14- 21) who exited high school: 1,116 1,007 886 929 994 1,214 1,393 Percent of youth with IEPs (ages 14- 21) who left high school by dropping out: 12.6% 12.0% 12.6% 18.7% 17.2% 12.1% 11.7% 5.1% 5.2% 4.9% 4.6% 4.3% 4.0% 3.7% Year target: Note: Data for this indicator are lag data. Describe the results of the State s examination of the data for the year before the reporting year (e.g., for the FFY 2020 SPP/APR, use data from 2019-2020), and compare the results to the target.
Indicator 13 Indicator 13 Transition Planning Transition Planning No Target Setting Feedback needed due to being a compliance Indicator where target must be 100% Federal Fiscal Year 2013 2014 2015 2016 2017 2018 2019 Number of youth aged 14 and above with IEPs that contain each of the required components for secondary transition: 77 6,820 7,700 7,675 8,514 8,034 9,304 Number of youth with IEPs aged 14 and above: 159 6,949 7,760 7,734 8,514 8,318 9,314 Percent of youth aged 14 and above or in the 8th grade with IEPs that contain each of the required components for secondary transition: 48.4% 98.1% 99.2% 99.2% 100.0% 96.6% 99.9%
Indicator 14 Indicator 14 Post School Outcomes Post School Outcomes Measure A: Higher Education Measure A: Higher Education Target Setting Feedback: What do you feel should be the annual percentage increase for target setting? Measurement: Percent enrolled in higher education = (Measure A) enrolled on a full-or part-time basis in a community college (two year program) or college/university (four or more year program) for at least one complete term, at any time in the year since leaving high school. Federal Fiscal Year 2013 2014 2015 2016 2017 2018 2019 Number of youth with IEPs in effect at the time they left school: 390 455 347 471 732 616 674 14A Number of youth with IEPs in effect at the time they left school who enrolled in higher education within one year of leaving high school: 77 286 219 233 303 281 360 14A Percent of youth with IEPs in effect at the time they left school who enrolled in higher education within one year of leaving high school: 20% 63% 63% 49% 41% 46% 53% 14A Year target: 21.0% 25.0% 29.0% 33.0% 37.0% 41.0% 45.0%
Indicator 14 Indicator 14 Post School Outcomes Post School Outcomes Measure B: Higher Education and Measure B: Higher Education and Competitive Integrated Employment Competitive Integrated Employment Target Setting Feedback: What do you feel should be the annual percentage increase for target setting? Measurement: Percent enrolled in higher education or competitively employed within one year of leaving high school = (Measure A + B) competitive integrated employment maintaining the standard of 20 hours a week, at or above minimum wage, and for at least 90 days at any time in the year since leaving high school. This definition applies to military employment. Federal Fiscal Year 2013 2014 2015 2016 2017 2018 2019 Number of youth with IEPs in effect at the time they left school: 390 455 347 471 732 616 674 14B Number of youth with IEPs in effect at the time they left school who enrolled in higher education or were competitively employed within one year of leaving high school: 205 358 282 389 455 453 495 14B Percent of youth with IEPs in effect at the time they left school who enrolled in higher education or were competitively employed within one year of leaving high school: 53% 79% 81% 83% 62% 74% 73% 52.0% 56.0% 60.0% 64.0% 68.0% 72.0% 76.0% 14B Year target:
Indicator 14 Indicator 14 Post School Outcomes Post School Outcomes Measure C: All Categories Measure C: All Categories Target Setting Feedback: What do you feel should be the annual percentage increase for target setting? Measurement: A + B + C Federal Fiscal Year 2013 2014 2015 2016 2017 2018 2019 Number of youth with IEPs in effect at the time they left school: 390 455 347 471 732 616 674 14C Number of youth with IEPs in effect at the time they left school who enrolled in higher Education or in some other postsecondary Education or training program or were competitively employed or in some other employment within one year of leaving high school: 256 376 298 406 597 499 591 14C Percent of youth with IEPs in effect at the time they left school who enrolled in higher Education or in someother postsecondaryEducation or training program or werecompetitively employed or in some otheremployment within one year of leaving high school: 66% 83% 86% 86% 82% 81% 88% 14C Year target: 100.0% 100.0% 100.0% 100.0% 100.0% 100.0% 100.0% *Enrolled in other postsecondary education or training means youth have been enrolled on a full or part-time basis for at least 1 complete term at any time in the year since leaving high school in an education or training program (e.g., Job Corps, adult education, workforce development program, vocational technical school which is less than a two year program). Engaged in some other employment means youth have worked for pay (less than 20 hours a week) or been self-employed for a period of at least 90 days at any time in the year since leaving high school. This includes working in a family business (e.g., farm, store, fishing, ranching, catering services, etc.).