Transparency in Early Warning System at Fairbanks School District

This presentation by Dr. Ellis M. Ott explores the importance of transparency in an early warning system, using data and statistics from Fairbanks North Star Borough School District in Alaska. The content covers attendance rates, graduation rates, student demographics, and risk factors based on attendance and GPA. It also discusses how a combination of attendance, grades, retention, former dropout status, credits, state/district assessments, and suspensions can help identify students at high, medium, and low risk for dropping out.

Download Presentation

Please find below an Image/Link to download the presentation.
The content on the website is provided AS IS for your information and personal use only. It may not be sold, licensed, or shared on other websites without obtaining consent from the author.If you encounter any issues during the download, it is possible that the publisher has removed the file from their server.
You are allowed to download the files provided on this website for personal or commercial use, subject to the condition that they are used lawfully. All files are the property of their respective owners.
The content on the website is provided AS IS for your information and personal use only. It may not be sold, licensed, or shared on other websites without obtaining consent from the author.
E N D
Presentation Transcript
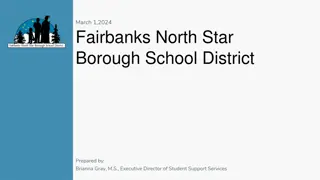
TRANSPARENCY IN AN EARLY WARNING SYSTEM PRESENTED BY ELLIS M. OTT, PH.D. FAIRBANKS NORTH STAR BOROUGH SCHOOL DISTRICT FAIRBANKS, ALASKA 1 2016 NCES STATS-DC Data Conference July 13
OUR SCHOOL DISTRICT ABOUT 14,000 STUDENTS, 35 SCHOOLS DROP-OUT RATE 4-6%, GRADUATION RATE 70% FREE/REDUCED PRICE LUNCH 36% SPECIAL EDUCATION SERVICES 16% 2 LIMITED ENGLISH PROFICIENT 3%
OUR SCHOOL DISTRICT Caucasian 60% African American 5% Hispanic 8% Asian/Pacific Islander 4% AK Native/American Indian 11% Two or more Races 12% 3
ATTENDANCE MATTERS 91% Graduation Rate by Attendance 88% 100% 90% 69% 80% 70% Graduation Rate 60% 50% 26% 40% 30% 5% 20% 2% 10% 0% Below 60% 60-69% 70%-79% Attendance Rate 80%-89% 90%-94% Goal (95%+) 4 Alternative programs excluded from the analysis due to fundamentally different attendance information; Some data compiled over 8 years (05-06 to 13-14)
ATTENDANCE AND GPA MATTERS Graduation Rate by Attendance with GPA < 2.0 100% 90% Graduation Rate 80% 54%56% 70% 39% 60% 50% 40% 15% 30% 1% 0% 20% 10% 0% Below 60% 60-69% 70%-79% 80%-89% 90%-94% Goal (95%+) Attendance Rate 86%93% 94% Graduation Rate by Attendance with GPA >= 2.0 100% 90% Graduation Rate 80% 56% 70% 60% 20%27% 50% 40% 30% 20% 10% 0% Below 60% 60-69% 70%-79% 80%-89% 90%-94% Goal (95%+) 5 Attendance Rate Alternative programs excluded from the analysis due to fundamentally different attendance information; Some data compiled over 8 years (05-06 to 13-14)
INITIAL RISK USING ATTENDANCE AND GPA 2.0-2.99 C 3.0-3.99 B 4.0+ A <1.0 F 1.0-1.99 D GPA Less than 70%* ATTENDANCE RATE 70% - 80%* 80% - 90%* More than 90%* 6 * For elementary students, the cut-offs are 85%, 90%, and 92%
EARLY WARNING SYSTEM INFORMATION ON ATTENDANCE AND GRADES COMBINED WITH: 1.RETENTION 2.FORMER DROPOUT 3.CREDITS VS GRADE LEVEL 4.STATE/DISTRICT ASSESSMENTS 5.OUT-OF-SCHOOL SUSPENSIONS TO DETERMINE HIGH, MEDIUM, AND LOW RISK FOR DROPOUT 7
FACTS for High Risk Students: Almost 2/3 of dropouts are High Risk students, despite being only 11% of All students 27 times more likely to dropout than Low Risk student Only about 12% graduate if High Risk continues 8
FACTS for High Risk Students: Less than 8% meet standards in Math Average GPA is 1 letter grade lower than their peers High Risk in Elementary High Risk in Secondary (over 50%) Dropout rate can be cut in HALF with interventions 9
DROPOUT RATES BY RISK Risk level LOW 71% MED 19% HIGH 10% Total 100% NO % of Non-Drops Count Dropout 21245 5703 2992 29940 YES Count 181 271 804 1256 % of DROPS 14% 22% 64% 100% DROPOUT RATE 0.8% 4.5% 21.2% 4% Total Count 21426 5974 3796 31196 % of TOTAL 69% 19% 11% 100% Aggregated across 5 years (10-11 to 14-15) 10
High + Med Risk High Risk Only 11 (Jared Knowles, 2015 Of Needles and Haystacks )
GRADUATION RATES BY RISK 94% 100% 90% 80% Graduation Rate 55% 70% 60% 50% 40% 12% 30% 20% 10% 0% High Risk Med Risk Low Risk 12
Dropout Rate by Groups and Risk: Student with Disability Dropout Rate = 7.4% Students without Disability Dropout Rate = 3.7% High Risk Dropout Rate: SWD = 21.3% Economic Disadvantage = 22% Non-ED = 20% Limited English Proficient = 16% Caucasian = 20.9% African-American = 17.8% Hispanic = 19.6% Asian/PI = 20% AK Native/American Indian = 23% non-SWD = 21.1% Non-LEP = 21.5% 13
DROPOUT RATES BY SERVICE INTERVENTIONS WITH HIGH RISK STUDENTS LEAD TO: COMPARISON GROUP (NO INTERVENTION) = 21.1% TREATMENT GROUP (INTERVENTION) = 10.8% 24+ CONTACTS GROUP = 7% EARLY WARNING SYSTEM IS A GAME CHANGER 14 Used Propensity Score Matching for analysis
GRADES 7-12 DROPOUT RATES 05 TO 15 10 Without Intervention With Intervention 7.6 7.5 6.7 Dropout Rate 5.9 5.4 5 4.9 5 4.6 4.5 4.3 4.2 3.9 4.2 3.9 2.5 0 2005 2006 2007 2008 2009 2010 2011 2012 2013 2014 2015 School Year 15
SCHOOL INPUT ON EARLY WARNING SYSTEMS 28 ADMINISTRATORS, COUNSELORS, SUPPORT STAFF, AND TEACHERS 21 SCHOOLS ASKED 6 QUESTIONS: SCHOOL, ROLE, STAFF INVOLVED, INTERVENTIONS USED, CHALLENGES, SUGGESTIONS, FINAL THOUGHTS 16
SCHOOL INPUT SUMMARY PRIMARY STAFF INVOLVED ARE COUNSELORS & PREVENTION/INTERVENTION SPECIALISTS INTERVENTIONS PROVIDED INCLUDE COUNSELING, PARENTAL CONTACT, 1-1 CONTACT WITH STAFF, AND REFERRAL TO VARIOUS DISTRICT PROGRAMS CHALLENGES SITED WERE PARENTAL INVOLVEMENT, ATTENDANCE, AND TIME & RESOURCES SCHOOL-BASED REFERRAL PROCESS SUGGESTED TO IMPROVE MODEL OTHER ADDITIONAL COMMENTS WERE REQUESTING FOR MORE SUPPORT AND PROFESSIONAL DEVELOPMENT 17
OUTREACH PRESENTATIONS TO VARIOUS STAKEHOLDERS TO BUILD SUPPORT: LOCAL SCHOOL BOARD PARENTAL ADVISORY COMMITTEES ALL PRINCIPALS MEETING (FUTURE PRESENTATION TO ALL FEDERAL PROGRAMS STAFF UPCOMING) 18
WHAT NEXT? PREVENTING DROPOUT IS A RETURN ON INVESTMENT ONE LESS DROPOUT MEANS THE SCHOOL DISTRICT RECEIVES ONE ADDITIONAL BASE STUDENT ALLOCATION FUNDING ANALYSIS SHOWED THAT A PROGRAM USING NEW COUNSELORS TO SERVE HIGH RISK STUDENTS COULD PAY ITSELF BACK SCHOOL BOARD EXPRESSED INTEREST IN RENEWING THE GRADUATION SUCCESS PROGRAM BIGGEST HURDLE TO OVERCOME? BUDGET 19
QUESTIONS? COMMENTS? THANK YOU FAIRBANKS NORTH STAR BOROUGH SCHOOL DISTRICT ELLIS OTT, PH.D. PHONE: 907-452-2000 X. 11364 E-MAIL: ELLIS.OTT@K12NORTHSTAR.ORG 20