Trends in Hazardous Drinking Patterns in New Zealand Population
Explore the prevalence of hazardous drinking patterns among different age groups and genders in New Zealand from 2006/07 to 2018/19. The data highlights trends in drinking behaviors, with a focus on males, females, and specific age categories. Discover insights into the variations in hazardous drinking rates among different ethnicities and how they have evolved over the years.

Download Presentation

Please find below an Image/Link to download the presentation.
The content on the website is provided AS IS for your information and personal use only. It may not be sold, licensed, or shared on other websites without obtaining consent from the author. If you encounter any issues during the download, it is possible that the publisher has removed the file from their server.
You are allowed to download the files provided on this website for personal or commercial use, subject to the condition that they are used lawfully. All files are the property of their respective owners.
The content on the website is provided AS IS for your information and personal use only. It may not be sold, licensed, or shared on other websites without obtaining consent from the author.
E N D
Presentation Transcript
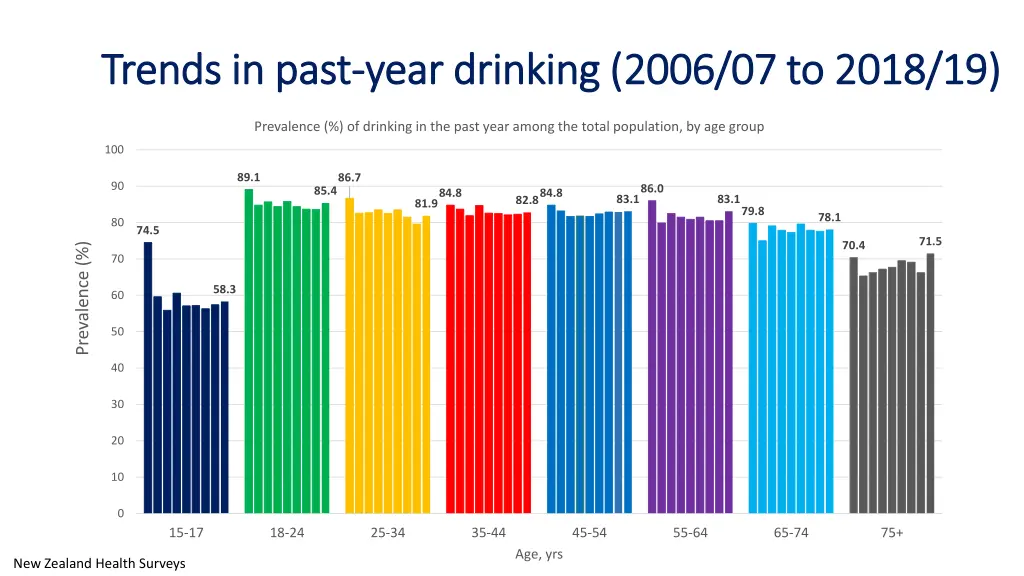
Trends in past Trends in past- -year drinking (2006/07 to 2018/19) year drinking (2006/07 to 2018/19) Prevalence (%) of drinking in the past year among the total population, by age group 100 89.1 86.7 90 86.0 85.4 84.8 84.8 83.1 83.1 82.8 81.9 79.8 78.1 80 74.5 71.5 70.4 Prevalence (%) 70 58.3 60 50 40 30 20 10 0 15-17 18-24 25-34 35-44 45-54 55-64 65-74 75+ Age, yrs New Zealand Health Surveys
Trends in hazardous drinking, by sex Trends in hazardous drinking, by sex Unadjusted prevalence (%) of hazardous drinking in the total population, by sex 45 40 35 28.6 * vs 2011 30 27.5 Prevalence (%) 27.3 27.1 Men 26.6 26.0 24.7 * vs 2006 25 22.1 22.0 21.6 20.8 * vs 2011 20.0 19.8 Total 19.5 19.3 20 18.0 * vs 2006 17.7 * vs 2006 * vs 2006 16.4 15.4 14.9 13.4 15 12.8 12.7 Women 12.4 12.3 11.1 11.0 10.6 9.1 8.6 * vs 2011 10 * vs 2006 5 0 2006/07 2011/12 2012/13 2013/14 2014/15 2015/16 2015/16 2016/17 2017/18 2018/19 New Zealand Health Surveys
Trends in hazardous drinking, males Trends in hazardous drinking, males Unadjusted prevalence (%) of hazardous drinking among the total male population, by ethnicity 45 43.5 40.0 39.0 38.8 38.7 38.4 40 37.9 M ori men 37.2 37.1 36.9 36.0 33.7 35 32.6 32.3 34.8 Prevalence (%) 29.6 29.5 29.4 30 Pacific men 27.4 27.0 29.8 30.4 26.2 28.4 29.0 * vs 2011 * vs 2014 27.0 25 25.7 22.9 European/Other men 22.3 21.8 20 15 11.7 10.9 10.1 Asian men 9.7 9.7 10 7.8 7.6 7.2 6.9 4.7 5 0 2006/07 2011/12 2012/13 2013/14 2014/15 2015/16 2015/16 2016/17 2017/18 2018/19 New Zealand Health Surveys
Trends in hazardous drinking, females Trends in hazardous drinking, females Unadjusted prevalence (%) of hazardous drinking among the total female population, by ethnicity 45 40 35 Prevalence (%) 29.4 30 27.6 27.1 27.0 M ori women * vs 2006 * vs 2011 25.3 25.2 24.8 24.2 25 23.1 Pacific women 20.9 20 European/Other women 15.2 14.6 14.1 14.0 13.7 13.7 13.3 15 13.3 10.7 13.9 10.2 13.5 12.3 Asian women 12.1 12.2 8.6 10 10.8 10.4 * vs 2011 8.6 8.1 3.2 5 2.6 2.4 2.2 2.2 2.2 2.0 1.8 1.8 1.7 0 2006/07 2011/12 2012/13 2013/14 2014/15 2015/16 2015/16 2016/17 2017/18 2018/19 New Zealand Health Surveys
Trends in hazardous drinking, 15 Trends in hazardous drinking, 15- -34 34 yrs yrs Unadjusted prevalance (%) of hazardous drinking among the total population, 15-34 year age-groups 43.2 45 40 37.1 35.4 33.9 33.4 35 32.9 32.6 32.4 31.7 18-24 * vs 2006 29.9 Prevalence (%) 30 27.6 27.1 26.3 25.3 * vs 2014 24.8 24.8 24.4 23.9 23.9 25 21.9 19.5 25-34 20 15.3 15 11.7 * vs 2006 11.5 10.8 15-17 10 8.0 7.9 7.6 7.2 6.3 5 0 2006/07 2011/12 2012/13 2013/14 2014/15 2015/16 2015/16 2016/17 2017/18 2018/19 New Zealand Health Surveys
Trends in hazardous drinking, 35yrs + Trends in hazardous drinking, 35yrs + Unadjusted prevalence (%) of hazardous drinking among the total population, 35 years and over 45 40 35 Prevalence (%) 30 * vs 2006 * vs 2011 25 35-44 22.4 22.3 22.3 22.2 22.0 22.1 19.5 22.2 22.9 16.4 18.5 * vs 2006 * vs 2011 20 45-54 21.0 17.6 18.3 16.6 16.6 16.1 16.0 15.9 14.8 14.4 13.2 55-64 16.3 15 12.9 12.5 * vs 2011 12.2 11.7 11.7 10.5 10.1 10.1 10.0 9.1 8.8 12.1 7.3 * vs 2006 * vs 2011 8.4 65-74 10 5.7 5.5 5.3 5.1 4.4 4.1 4.1 3.6 75+ 5 2.9 2.8 2.0 1.8 1.6 0 2006/07 2011/12 2012/13 2013/14 2014/15 2015/16 2015/16 2016/17 2017/18 2018/19 New Zealand Health Surveys