Trends in Indiana Clandestine Lab Incidents
Annual data on Indiana State Police lab incidents from 2016 to 2018, including lab seizures, percentage changes year-to-year, and comparison with law enforcement incidents from 1995 to 2018. Details on seized one-pot reaction vessels and HCl generators, as well as a comparison of lab seizures before and after the implementation of NPLEx tracking system.

Download Presentation

Please find below an Image/Link to download the presentation.
The content on the website is provided AS IS for your information and personal use only. It may not be sold, licensed, or shared on other websites without obtaining consent from the author.If you encounter any issues during the download, it is possible that the publisher has removed the file from their server.
You are allowed to download the files provided on this website for personal or commercial use, subject to the condition that they are used lawfully. All files are the property of their respective owners.
The content on the website is provided AS IS for your information and personal use only. It may not be sold, licensed, or shared on other websites without obtaining consent from the author.
E N D
Presentation Transcript
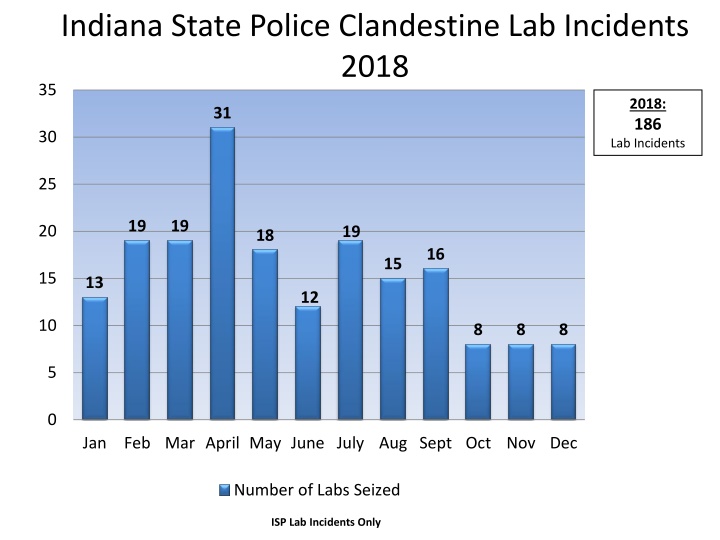
Indiana State Police Clandestine Lab Incidents 2018 35 2018: 186 31 30 Lab Incidents 25 19 19 20 19 18 16 15 15 13 12 10 8 8 8 5 0 Jan Feb Mar April May June July Aug Sept Oct Nov Dec Number of Labs Seized ISP Lab Incidents Only
Annual Comparison ISP Clandestine Lab Incidents 2016 2018 2016 2017 2018 140 129 116 2018: 2018 = 186 2017 = 371 2016 = 943 120 99 112 100 72 80 85 72 60 64 4649 44 57 51 39 51 47 40 25 31 24 39 16 22 14 28 20 19 19 19 13 18 16 15 13 12 8 8 8 0 Jan Feb Mar April May June July Aug Sept Oct Nov Dec Percent Change Year-to-Date, 2016 to 2017 = -60.66% Percent Change Year-to-Date, 2017 to 2018 = -49.87% Percent Change Year-to-Date, all years shown (2016 to 2018) = -80.28% ISP Lab Incidents Only
Indiana Law Enforcement Clandestine Lab Incidents 1995 2018 2000 1808 1726 1800 1437 1600 1488 1530 13641395 1400 1137 1104 1200 1065 1011 983 1000 803832 732 800 542 600 387 314 400 192 129 200 6 1328 43 0 1995 1999 2003 2007 2011 2015 2018 ISP Labs Other Agency Labs Reported to ISP via EPIC Submission All Agencies Lab Incidents
One Pot Reaction Vessels and HCl Generators Seized 2015-2018 2015 2016 2017 2018 3,500 3,233 3,058 3,000 2,500 1832 2,000 1955 1,530 1,500 983 1,000 427 458 371 351 259 169 221 192 500 97 19 0 Labs Incidents One Pot Rxn Vessels HCl Generators Plastic Bottles & Mason Jars ISP has been asked by several entities if labs are counted by bottles in Indiana. All reporting agencies in the state count labs by individual site or multiple sites in an area if the labs have been dumped with no suspect information. One pot reaction vessels, HCl generators and empty plastic bottles/mason jars are indicative that manufacturing has taken place or will take place. Data includes all agencies lab incidents.
Comparison of Lab Seizures: Pre-tracking of PSE 3 years before NPLEx PSE block sale system tracking and after 2000 1726 1808 1800 1530 1437 1488 1395 1600 1364 1400 1200 983 1000 800 600 387 400 192 200 0 2009 2010 2011 NPLEx fully implemented 1-1-2012 All Agencies Lab Incidents 2012 2013 2014 2015 2016 2017 2018
Indiana State Police Lab Seizure Type 2018 Birch Reduction (Nazi) Red Phosphorus One Pot Other/Unk 3% 8% 88% 2018: Birch Reduction 14 Red Phosphorus 2 One Pot 164 Other/Unknown 6 ISP Lab Incidents Only
Indiana State Police Children Identified in Clandestine Lab Environments 2018 3.5 2018: 14 Children Identified 3 3 2.5 2 2 2 2 2 2 1.5 1 1 0.5 0 0 0 0 0 0 Jan Feb Mar April May June July Aug Sept Oct Nov Dec Number of Children Affected ISP Lab Incidents Only
Annual Comparison ISP Children Indentified in Clandestine Lab Environments 2016 2018 2016 2017 2018 35 2018: 2018 = 14 2017 = 49 2016 = 153 30 30 26 25 24 20 15 13 12 14 1010 10 7 7 5 6 9 4 5 5 4 6 2 2 3 3 2 1 2 2 2 2 0 1 1 0 0 0 0 0 0 1 Jan Feb Mar April May June July Aug Sept Oct Nov Dec Percent Change Year-to-Date, 2016 to 2017 = -67.97% Percent Change Year-to-Date, 2017 to 2018 = -71.43% Percent Change Year-to-Date, all years shown (2016 to 2018) = -90.85% ISP Lab Incidents Only
Indiana Law Enforcement Children Identified in Clandestine Lab Environments 2007 - 2018 500 458 450 388 382 369 400 323 350 282 300 250 185 159 200 156 125 150 100 51 14 50 0 2007 2008 2009 2010 2011 2012 2013 2014 2015 2016 2017 2018 ISP Labs Other Agency Children Indentified as Reported to ISP via EPIC Submission All Agencies Lab Incidents
Indiana Meth Lab Injuries and Deaths 2007- 2018 Adults Injured Adult Deaths Children Injured Child Deaths LE Injured 60 51 50 36 40 34 27 30 24 17 17 16 20 14 14 12 8 8 8 8 7 6 10 4 4 3 3 3 2 1 1 1 1 1 1 0 1 0 1 0 0 2007 2008 2009 2010 2011 2012 2013 2014 2015 2016 2017 2018 Child Deaths: Fire: 1 Medical/Health: 1 Overdose: 1 Adult Deaths: Police Action Shooting: 4 Pursuit Crash: 2 Car Crash: 1 Suicide: 4 Fire/Explosion: 11 Homicide: 3 One Pot Explosion(no fire): 1 Overdose: 2 Other: 3 Adult Injuries: 284 total Law Enforcement Injuries: 129 total Child Injuries: Fire: 7 Chemical Burns: 2 Exposure to Chemical Vapors: 9 Swallowed Chemical: 3 All Agencies Lab Incidents
Indiana State Police Clandestine Lab Arrests & Suspects Identified But Not Arrested at Time of Lab - 2018 12 2018: 81 Arrests 33 Identified 10 10 10 9 9 8 8 8 7 6 6 5 5 5 5 4 4 4 4 3 3 3 3 2 2 1 0 0 0 0 Jan Feb Mar April May June July Aug Sept Oct Nov Dec Number of Arrests Other Suspects Identified ISP Lab Incidents Only
Annual Comparison ISP Clandestine Lab Arrests 2015 2018 2016 2017 2018 2018: 2018 = 81 2017 = 189 2016 = 622 120 103 100 89 83 80 55 60 56 48 40 45 40 27 28 25 24 26 20 32 25 20 15 10 13 21 10 8 10 10 4 9 8 8 9 5 5 4 4 3 6 0 4 Jan Feb Mar April May June July Aug Sept Oct Nov Dec Percent Change Year-to-Date, 2016 to 2017 = -69.61% Percent Change Year-to-Date, 2017 to 2018 = -57.14% Percent Change Year-to-Date, all years shown (2016 to 2018) = -86.98% ISP Lab Incidents Only
Indiana Law Enforcement Clandestine Lab Arrests 2007 2018 14821551 1600 1420 1316 1400 1252 1139 1200 1045 1000 764 800 636 546 600 400 194 200 83 0 2007 2008 2009 2010 2011 2012 2013 2014 2015 2016 2017 2018 ISP Labs Other Agency Arrests Reported to ISP via EPIC Submission All Agencies Lab Incidents
Annual Comparison Lab Incidents & Lab Arrests 2007 - 2018 16631721 14481507 1800 1600 14161452 1263 13431346 1363 1212 1400 1328 1087 1200 1059 1031 943 1000 820 739 800 622 534 600 371 400 186 189 200 81 0 2007 2008 2009 2010 2011 2012 2013 2014 2015 2016 2017 2018 Lab Incidents Lab Incident Arrests Average arrest rate of lab seizures - 2007-2018 = 80.7% ISP Lab Incidents Only