Trends in U.S. Veterans with CKD: Nephrology Visits Analysis
Among U.S. veterans, the percentage of individuals with Chronic Kidney Disease (CKD) Stage 4 seeking nephrology evaluation was analyzed over the period of 2018-2022, highlighting trends by race, age, sex, and diabetes status. The data shows varying levels of nephrologist visits among non-Hispanic Black, non-Hispanic White veterans, and other demographic groups, with potential impacts from the COVID-19 pandemic observed. Understanding these trends is crucial for improving CKD management and patient outcomes.

Download Presentation

Please find below an Image/Link to download the presentation.
The content on the website is provided AS IS for your information and personal use only. It may not be sold, licensed, or shared on other websites without obtaining consent from the author. If you encounter any issues during the download, it is possible that the publisher has removed the file from their server.
You are allowed to download the files provided on this website for personal or commercial use, subject to the condition that they are used lawfully. All files are the property of their respective owners.
The content on the website is provided AS IS for your information and personal use only. It may not be sold, licensed, or shared on other websites without obtaining consent from the author.
E N D
Presentation Transcript
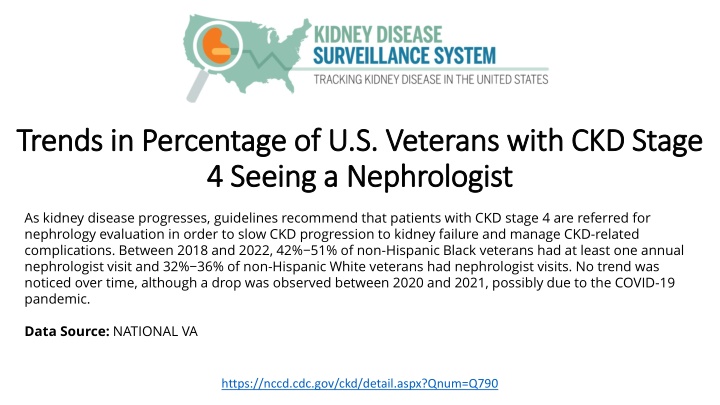
Trends in Percentage of U.S. Veterans with CKD Stage Trends in Percentage of U.S. Veterans with CKD Stage 4 Seeing a Nephrologist 4 Seeing a Nephrologist As kidney disease progresses, guidelines recommend that patients with CKD stage 4 are referred for nephrology evaluation in order to slow CKD progression to kidney failure and manage CKD-related complications. Between 2018 and 2022, 42% 51% of non-Hispanic Black veterans had at least one annual nephrologist visit and 32% 36% of non-Hispanic White veterans had nephrologist visits. No trend was noticed over time, although a drop was observed between 2020 and 2021, possibly due to the COVID-19 pandemic. Data Source: NATIONAL VA https://nccd.cdc.gov/ckd/detail.aspx?Qnum=Q790
Trends in Percentage of U.S. Veterans with CKD Trends in Percentage of U.S. Veterans with CKD Stage 4 Seeing a Nephrologist, Overall Stage 4 Seeing a Nephrologist, Overall 45 % Veterans with Nephrology Visit 40 35 30 25 20 15 10 5 0 2018 2019 2020 2021 2022
Trends in Percentage of U.S. Veterans with CKD Trends in Percentage of U.S. Veterans with CKD Stage 4 Seeing a Nephrologist, by Age Category Stage 4 Seeing a Nephrologist, by Age Category 70 % Veterans with Nephrology Visit 60 50 40 30 20 10 0 2018 2019 2020 2021 2022 20 29 years 30 39 years 40 49 years 50 59 years 60 69 years 70+ years
Trends in Percentage of U.S. Veterans with CKD Trends in Percentage of U.S. Veterans with CKD Stage 4 Seeing a Nephrologist, by Sex Stage 4 Seeing a Nephrologist, by Sex % Veterans with Nephrology Visit 45 40 35 30 25 20 15 10 5 0 2018 2019 2020 2021 2022 Male Female
Trends in Percentage of U.S. Veterans with CKD Trends in Percentage of U.S. Veterans with CKD Stage 4 Seeing a Nephrologist, by Race/Ethnicity Stage 4 Seeing a Nephrologist, by Race/Ethnicity % Veterans with Nephrology Visit 60 50 40 30 20 10 0 2018 2019 2020 2021 2022 Non-Hispanic Black American Indian/AK Native Asian Non-Hispanic White Hispanic Unknown Native HI/Pacific Islander
Trends in Percentage of U.S. Veterans with CKD Trends in Percentage of U.S. Veterans with CKD Stage 4 Seeing a Nephrologist, by Diabetes Stage 4 Seeing a Nephrologist, by Diabetes % Veterans with Nephrology Visit 50 40 30 20 10 0 2018 2019 2020 2021 2022 With Diabetes Without Diabetes
Trends in Percentage of U.S. Veterans with CKD Trends in Percentage of U.S. Veterans with CKD Stage 4 Seeing a Nephrologist, by Hypertension Stage 4 Seeing a Nephrologist, by Hypertension 50 % Veterans with Nephrology Visit 40 30 20 10 0 2018 2019 2020 2021 2022 With Hypertension Without Hypertension