Trip Generation Rates for Retirement Homes in South Africa
This study explores the unique trip generation rates for retirement facilities such as retirement homes and villages in South Africa. It delves into the trip generation potential of these facilities and the methodology used to determine trip rates.

Download Presentation

Please find below an Image/Link to download the presentation.
The content on the website is provided AS IS for your information and personal use only. It may not be sold, licensed, or shared on other websites without obtaining consent from the author.If you encounter any issues during the download, it is possible that the publisher has removed the file from their server.
You are allowed to download the files provided on this website for personal or commercial use, subject to the condition that they are used lawfully. All files are the property of their respective owners.
The content on the website is provided AS IS for your information and personal use only. It may not be sold, licensed, or shared on other websites without obtaining consent from the author.
E N D
Presentation Transcript
Trip Generation Rates for Retirement Trip Generation Rates for Retirement Homes and Villages in SA Homes and Villages in SA 12 July 2017 South African Transport Conference SESSION 3B Judith Roux Megan Bruwer: Stellenbosch University
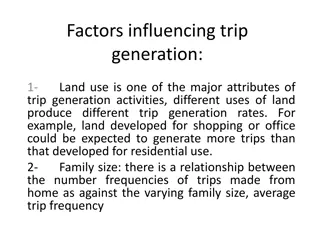
Introduction Trip generation: Traffic Impact Study Transport Planning Objectives: Are a unique set of trip generation rates needed for retirement facilities? What is the trip generation potential of these facilities? Retirement facilities: Retirement home Retirement village
Trip Generation Trip Generation Rate: ?????? ?? ????? ??????????? ???????? ???? ??? ???? = Specific to land-use Quantifiable independent variable Trip Generation Rate 80 Trips (veh/h) 60 40 20 0 0 20 40 60 80 GLA (100 m2)
Trip Generation Trip Generation Rate: ?????? ?? ????? ??????????? ???????? ???? ??? ???? = Specific to land-use Quantifiable independent variable Trip Generation Rate 80 70 60 Trips (veh/h) 50 40 30 20 10 0 0 10 20 30 40 50 60 70 80 GLA (100 m2) Trip Generation Equation: Regression analysis to compare trips and variables that are not linearly related and that do not necessarily go through zero
Trip Generation SA Trip Generation Rates Manual (DOT, 1995): NONE TMH 17: South African Trip Data Manual (COTO, 2013): Old-age homes Retirement villages Period of indicator Trip gen. rate Split Trip gen. rate Split AM peak hour 0.15 65 : 35 0.35 40 : 60 PM peak hour 0.20 40 : 60 0.35 50 : 50 0.35 50:50 0.4 50:50 Midday DOT, 1995 Residential Trip gen. rate AM/PM peak AM/PM peak Cluster Low Income 1.1 0.8
Trip Generation Trip rate percentiles: SA Trip Generation Rates Manual (DOT, 1995): 75th percentile rate TMH 17: South African Trip Data Manual (COTO, 2013): average rate 75th percentile: more conservative (higher trip estimates) takes into account variance from the mean representative of 75% of observed data
Methodology Traffic counts: Observed traffic movements Survey: Information of each facility Independent variables: Number of housing units (typical for residential) Employees (employment generator)
Data Collection 10 retirement facilities: 3 retirement homes 7 retirement villages Mostly in Western Cape (both Cape Town and Winelands) 1 comparison study in Limpopo (Waterberg District) 06:00 17:45 (4 studies) 06:00 9:00, 16:00 17:45 (6 studies)
Results: Traffic Patterns Average Daily vehicle trip distribution 100 90 80 Trips per hour 70 60 50 40 30 20 10 0 10:30 Starting time of hourly trips Retirement villages 10:00 10:15 10:45 11:00 11:15 11:30 11:45 12:00 12:15 12:30 12:45 13:00 13:15 13:30 13:45 14:00 14:15 14:30 14:45 15:00 15:15 15:30 15:45 16:00 16:15 16:30 16:45 17:00 17:15 7:30 6:45 7:00 7:15 7:45 8:00 8:15 8:30 8:45 9:00 9:15 9:30 9:45 Retirement Homes
Results: Retirement Homes Relatively few trips being made, consistent throughout day Very similar directional split at all three facilities Housing Units 56 125 96 Generator Peak Trips 12 17 13 50:50 Development Employees AM Trips PM Trips RH1 RH2 RH3 49 70 50 12 13 12 11 15 18 Directional Split (in:out) 60:40 45:55
Results: Retirement Villages Clear peak in the late morning (10:00) generator peak Trips generated by Retirement Villages during peak periods 180 160 140 Number of Trips 120 100 80 60 40 20 0 0 100 200 300 400 500 600 700 Number of Housing Units PM Peak Period AM Peak Period Generator Peak Period
Results: Retirement Villages Clear peak in the late morning (10:00) generator peak Trips generated by Retirement Villages during peak periods 180 160 140 Number of Trips 120 100 80 60 40 20 0 0 100 200 300 400 500 600 700 Number of Housing Units PM Peak Period AM Peak Period Generator Peak Period
Results: Retirement Villages Clear peak in the late morning (10:00) generator peak Trips generated by Retirement Villages during peak periods 180 160 140 Number of Trips 120 100 80 60 40 20 0 0 100 200 300 400 500 600 700 Number of Housing Units PM Peak Period AM Peak Period Generator Peak Period
Trip Generation Rate Results Retirement Homes Directional split (in:out) Trip Generation Rates Characteristic AM Peak PM Peak Gen Peak AM PM Gen. Average 0.148 0.168 0.162 Housing Unit 75th %tile 0.187 0.196 0.190 60:40 45:55 50:50 Average 0.224 0.266 0.249 Employees 75th %tile 0.246 0.321 0.256
Trip Generation Rate Results Retirement Homes 30 Actual data points 25 Linear regression curve 20 Trips generated 15 Logarithmic regression curve R2 = 0.413 10 Trip generation rate R2 = 0.516 5 Average trip generation rate 0 0 20 40 60 80 100 120 140 160 Number of units
Trip Generation Rate Results Retirement Villages Directional split (in:out) Trip Generation Rates Characteristic AM Peak PM Peak Gen Peak AM PM Gen. Average 0.201 0.214 0.260 Housing Unit 75th %tile 0.239 0.251 0.311 35:65 55:45 40:60 Average 1.553 1.714 2.099 Employees 75th %tile 2.131 2.448 2.984
Trip Generation Rate Results Retirement Villages 200 180 Actual data points 160 140 Linear regression curve Trips generated R2 = 0.770 120 Logarithmic regression curve 100 R2 = 0.904 80 Trips generated 60 40 Average trip generation rate 20 0 0 200 400 600 800 Number of units
Trip Generation Rate Results Retirement Homes Trip Generation Rates AM Peak Average 0.148 75th %tile 0.187 Average 0.224 75th %tile 0.246 Split (in:out) AM PM Characteristic PM Peak 0.168 0.196 0.266 0.321 Gen Peak 0.162 0.190 0.249 0.256 Gen. Housing Unit 60:40 45:55 50:50 Employees Retirement Village Trip Generation Rates AM Peak Average 0.201 75th %tile 0.239 Average 1.553 75th %tile 2.131 Split (in:out) AM PM Characteristic PM Peak 0.214 0.251 1.714 2.448 Gen Peak 0.260 0.311 2.099 2.984 Gen. Housing Unit 35:65 55:45 40:60 Employees
Recommendations for Trip Generation Use number of housing units as independent variable Best correlation for all facilities Number of employees varies greatly depending on facility Use equations where possible (but with caution) non-linear Use the 75th percentile trip generation rates More conservative (for already very low trip generation) Less significantly influenced by outliers
200 180 Actual data points Linear regression curve Logarithmic regression curve Trips generated Recommendations for Trip Generation 140 Trips generated 160 120 Use number of housing units as independent variable Best correlation for all facilities Number of employees varies greatly depending on facility 40 100 80 60 20 Average trip generation rate 0 Use equations where possible (but with caution) non-linear 0 200 400 600 800 Number of units Use the 75th percentile trip generation rates More conservative (for already very low trip generation) Less significantly influenced by outliers
Recommendations for Trip Generation Definitely NOT appropriate to use trip rates for other residential Trip generation is much lower than even low cost residential Peak period is during the mid-morning (10:00) Trip gen rates found to be similar to those of TMH 17 Particularly similar for retirement homes Slightly lower in this study than TMH 17 for retirement villages Good correlation of directional split Where was data collected of TMH 17 and what was sample size?
Recommendations for Trip Generation Trip gen rates found to be similar to those of TMH 17 Old-age homes Trip gen. rate Retirement villages Trip gen. rate TMH 17 Split Split AM peak hour 0.15 65 : 35 0.35 40 : 60 PM peak hour 0.20 40 : 60 0.35 50 : 50 0.35 50:50 0.4 50:50 Midday Retirement homes Trip gen. rate Retirement villages Trip gen. rate THIS STUDY Split Split AM peak hour 0.19 60 : 40 0.24 35 : 65 PM peak hour 0.20 45 : 55 0.25 55 : 45 0.19 50:50 0.31 40:60 Mid-morning
Conclusion Objectives: Are a unique set of trip generation rates needed for retirement facilities? What is the trip generation potential of these facilities? YES: we need a unique set of rates For retirement homes AND retirement villages Trip generation potential similar to TMH 17
THANK YOU Questions? Contact: Megan Bruwer (mbruwer@sun.ac.za)