Uncover key insights about the impact of TV on driving brand search volume, website traffic, online-born businesses, and short-term profit efficiency. TV emerges as a significant driver of website visits and brand search, contributing 42% of all visits and creating 62% of short-term profit efficiently. Online-born businesses allocate 20% of linear TV spend, showcasing a shifting trend in advertising focus. Learn how TV remains a dominant force in the marketing landscape through data-driven analyses.
Please find below an Image/Link to download the presentation.
The content on the website is provided AS IS for your information and personal use only. It may not be sold, licensed, or shared on other websites without obtaining consent from the author. If you encounter any issues during the download, it is possible that the publisher has removed the file from their server.
You are allowed to download the files provided on this website for personal or commercial use, subject to the condition that they are used lawfully. All files are the property of their respective owners.
The content on the website is provided AS IS for your information and personal use only. It may not be sold, licensed, or shared on other websites without obtaining consent from the author.
E N D
Presentation Transcript
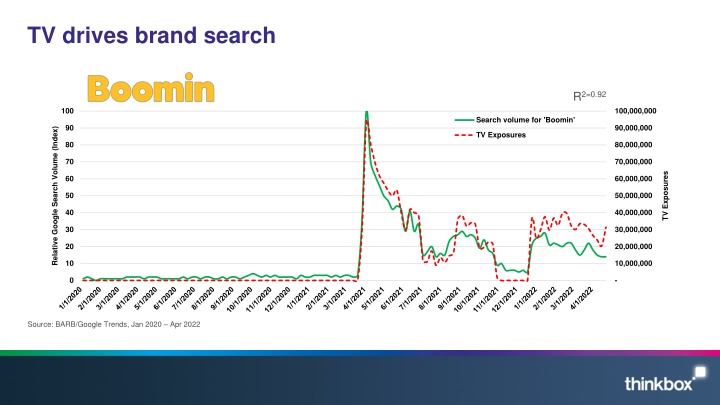
TV drives brand search R2=0.92 100 100,000,000 Search volume for 'Boomin' 90 90,000,000 Relative Google Search Volume (Index) TV Exposures 80 80,000,000 70 70,000,000 TV Exposures 60 60,000,000 50 50,000,000 40 40,000,000 30 30,000,000 20 20,000,000 10 10,000,000 0 - Source: BARB/Google Trends, Jan 2020 Apr 2022
TV is the biggest single source of website traffic Contributing 42% of all visits, around 50m in all Social 5% Radio 3% Out of Home 6% Other drivers 19% Search 25% TV 42% Breakdown of web visits by driver Source: Magic Numbers, The TV playbook for online businesses (2021)
Online-born businesses account for 20% of linear TV spend 1,200 +42% 1,000 800 MILLIONS 600 400 +12% +10% +28% +40% +9% +19% 200 +20% +17% +28% 0 Online-born Food Cosmetics & Personal Care Finance Entertainment & Leisure Government Social Political Organisation Telecoms Motors Household Fmcg Retail Source: Nielsen, 2021 Online Born and Predominantly Online are Thinkbox-created categories which consist of all online-only brands and online services from bricks and mortar businesses (Predominantly Online ranked 17th largest category) (YoY category % change)
TV creates 62% of short-term profit at the highest efficiency 2.50 Bubble size represents % of short-term return TV: 62% SHORT-TERM PROFIT ROI EFFICIENCY 2.00 Radio: 5% Print: 22% 1.50 Online Video: 5% 1.00 BREAK EVEN Online Display: 2% OOH: 3% 0.50 0.00 0% 10% 20% 30% 40% 50% 60% 70% % OF BUDGET NB: Online Video includes Broadcaster VOD, YouTube, Facebook video & online programmatic video Source: Profit Ability: the business case for advertising , November 2017 Ebiquity ROI campaign database (Feb 14-May 17). Campaign obs: 1954