TV viewing 2010-2020
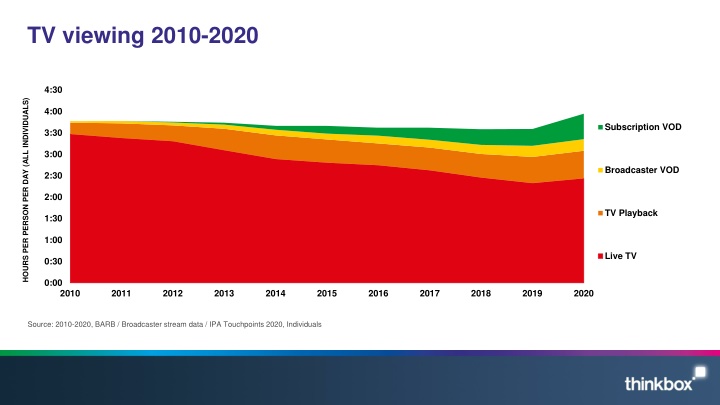
This data provides a detailed overview of TV viewing trends from 2010 to 2020, including hours per person per day, subscription VOD, broadcaster VOD, TV playback, live TV, and more. It also delves into video consumption habits, advertising viewing, and how individuals of different age groups engage with content across various platforms. Exploring the impact of technology and changing preferences, this analysis offers valuable insights into the evolving landscape of television consumption.

Download Presentation

Please find below an Image/Link to download the presentation.
The content on the website is provided AS IS for your information and personal use only. It may not be sold, licensed, or shared on other websites without obtaining consent from the author.If you encounter any issues during the download, it is possible that the publisher has removed the file from their server.
You are allowed to download the files provided on this website for personal or commercial use, subject to the condition that they are used lawfully. All files are the property of their respective owners.
The content on the website is provided AS IS for your information and personal use only. It may not be sold, licensed, or shared on other websites without obtaining consent from the author.
E N D
Presentation Transcript
TV viewing 2010-2020 4:30 HOURS PER PERSON PER DAY (ALL INDIVIDUALS) 4:00 Subscription VOD 3:30 3:00 Broadcaster VOD 2:30 2:00 TV Playback 1:30 1:00 Live TV 0:30 0:00 2010 2011 2012 2013 2014 2015 2016 2017 2018 2019 2020 Source: 2010-2020, BARB / Broadcaster stream data / IPA Touchpoints 2020, Individuals
2020 video viewing ALL INDIVIDUALS Average video time per day 3.5% All Individuals: 5hrs, 16 mins 16-34s: 4hrs, 54 mins 13.0% 16-34s 9.3% 0.9% TikTok 3.0% YouTube 36.3% 2.8% 0.1% 25.2% Facebook 1.7% Other online video Online 'adult' XXX video 63.7% 11.2% Cinema 0.7% 4.6% 2.6% 1.8% DVD 19.3% 0.1% Subscription VOD Broadcaster TV Source: 2020, BARB / Broadcaster stream data / comScore / IPA Touchpoints 2020 (lockdown) / Pornhub / Rentrak
How we watch broadcaster TV 8% 19% 19% BVOD Playback Live BVOD Playback Live 16-34 Inds 54% 27% 73% 3 hrs 22 mins 1 hrs 47 min Source: 2020, BARB / Broadcaster stream data
2020 video viewing on a TV set ALL INDIVIDUALS Average video time per day (TV set) All Individuals: 4hrs, 0 mins (76% total video day) 3.9% 2.0% 16-34s: 2hrs, 42 mins (53% total video day) 16-34s 11.6% 6.7% 3.0% YouTube 26.1% DVD Subscription VOD 64.1% Broadcaster TV 82.5% Source: 2020, BARB / Broadcaster stream data / comScore / IPA Touchpoints 2020
ALL INDIVIDUALS 2020 video advertising viewing Average video advertising time per day 0.1% 1.4% 5.6% All Individuals: 19 mins 16-34s: 12.5 mins 1.8% 16-34s 5.2% 15.5% TikTok* 2.0% 0.2% YouTube Other online video 77.0% Cinema Broadcaster TV 91.1% Source: 2020, BARB / comScore / Broadcaster stream data / IPA Touchpoints 2020 / Rentrak
How we watch broadcaster TV advertising 12% 4% 7% 11% BVOD Playback Live Inds 16-34 77% 89% 9.7 mins 17.5 mins Source: 2020 - BARB / Broadcaster stream data