U-NII Band Status in Japan for NB-Assisted UWB Systems
This document presents the current status and future plans regarding the U-NII band in Japan, specifically focusing on narrowband-assisted Ultra-Wideband (UWB) systems. It outlines the purpose of improving coexistence among UWB devices, proposes solutions for interference mitigation, and addresses strategies for effective channel access. The content covers topics such as safeguards for data use cases, interference mitigation techniques, and enhancements for higher density and traffic scenarios. Additionally, it touches upon the utilization of pilot Narrowband (NB) radios, improvements in link budget, and coexistence mechanisms for UWB devices.

Download Presentation

Please find below an Image/Link to download the presentation.
The content on the website is provided AS IS for your information and personal use only. It may not be sold, licensed, or shared on other websites without obtaining consent from the author.If you encounter any issues during the download, it is possible that the publisher has removed the file from their server.
You are allowed to download the files provided on this website for personal or commercial use, subject to the condition that they are used lawfully. All files are the property of their respective owners.
The content on the website is provided AS IS for your information and personal use only. It may not be sold, licensed, or shared on other websites without obtaining consent from the author.
E N D
Presentation Transcript
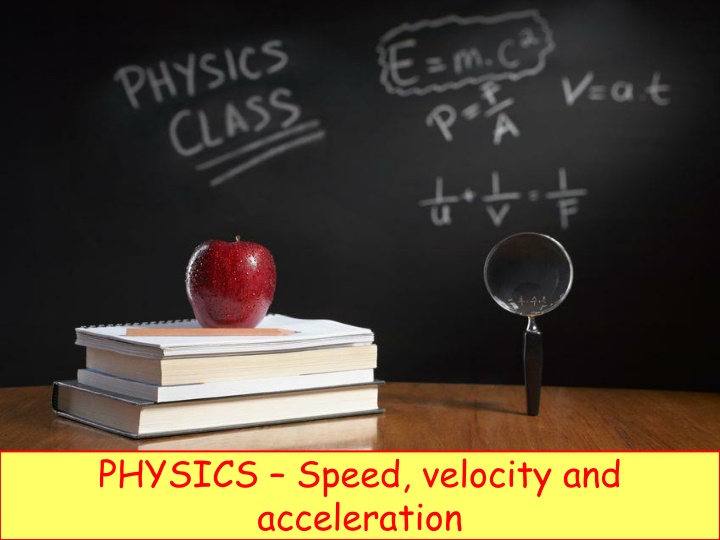
PHYSICS Speed, velocity and acceleration
LEARNING OBJECTIVES 1.2 Motion Core Define speed and calculate average speed from total time / total distance Plot and interpret a speed-time graph or a distance- time graph Recognise from the shape of a speed- time graph when a body is at rest moving with constant speed moving with changing speed Calculate the area under a speed-time graph to work out the distance travelled for motion with constant acceleration Demonstrate understanding that acceleration and deceleration are related to changing speed including qualitative analysis of the gradient of a speed-time graph State that the acceleration of free fall for a body near to the Earth is constant Supplement Distinguish between speed and velocity Define and calculate acceleration using time taken change of velocity Calculate speed from the gradient of a distance-time graph Calculate acceleration from the gradient of a speed-time graph Recognise linear motion for which the acceleration is constant Recognise motion for which the acceleration is not constant Understand deceleration as a negative acceleration Describe qualitatively the motion of bodies falling in a uniform gravitational field with and without air resistance (including reference to terminal velocity)
Average speed+= Distance moved Time taken A
Average speed+= Distance moved Time taken Distance measured in metres (m) Time measured in seconds (s) Speed - metres per second (m/s) A
Average speed+= Distance moved Time taken Example: A Car travels 50m time 2s speed = 50/2 = 25 m/s 25 m.s-1
So if thats speed, what is velocity?
Velocity is speed in a given direction.
Velocity is speed in a given direction. Velocity is 25m/s due west
Example: Cyclist +10m/s to the right
Example: Cyclist +10m/s to the right -10m/s to the left
Whats your vector Victor?
Whats your vector Victor? Quantities such as velocity are called vectors because they have size and direction
Acceleration is the rate at which an object increases speed or velocity.
Acceleration is the rate at which an object increases speed or velocity. Acceleration = change in velocity time taken
Acceleration is the rate at which an object increases speed or velocity. Acceleration = change in velocity time taken Also written as: a = v - u t
Acceleration is the rate at which an object increases speed or velocity. Acceleration = change in velocity time taken Velocity measured in m/s Time measured in s Acceleration measured in m/s/s or m/s2
Example: a drag car increases its velocity from zero to 60m/s in 3s. a = v - u t
Example: a drag car increases its velocity from zero to 60m/s in 3s. a = v - u t a = 60 0 3
Example: a drag car increases its velocity from zero to 60m/s in 3s. a = v - u t a = 60 0 3 a = 60 = 20m/s-2 3
Example: a drag car increases its velocity from zero to 60m/s in 3s. a = v - u t a = 60 0 3 a = 60 = 20m/s-2 3 Don t forget that acceleration is a vector it has size and direction
Deceleration (retardation) Deceleration is negative acceleration the object is slowing down. Eg. 4m/s2
Constant acceleration example 6s A B Car passes point A with a velocity of 10m/s. It has a steady (constant) acceleration of 4m/s2. What is the velocity when it passes point B?
Constant acceleration example 6s A B Car passes point A with a velocity of 10m/s. It has a steady (constant) acceleration of 4m/s2. What is the velocity when it passes point B? Solution: car gains 4m/s of velocity every second. In 6s it gains an extra 24m/s.
Constant acceleration example 6s A B Car passes point A with a velocity of 10m/s. It has a steady (constant) acceleration of 4m/s2. What is the velocity when it passes point B? Solution: car gains 4m/s of velocity every second. In 6s it gains an extra 24m/s. Final velocity = initial velocity + extra velocity
Constant acceleration example 6s A B Car passes point A with a velocity of 10m/s. It has a steady (constant) acceleration of 4m/s2. What is the velocity when it passes point B? Solution: car gains 4m/s of velocity every second. In 6s it gains an extra 24m/s. Final velocity = initial velocity + extra velocity Final velocity = 10 + 24 = 34m/s
Stationary Travelling at constant speed
Travelling at constant speed Stationary Travelling at constant speed
Speed = distance time
Speed = distance time
Speed = distance time
Speed = distance time Speed = 8 = 1 km/h 8
Acceleration from velocity : time graph Steady acceleration
Acceleration from velocity : time graph Steady velocity Steady acceleration
Acceleration from velocity : time graph Steady velocity Steady deceleration Steady acceleration
Acceleration from velocity : time graph Acceleration = V - U t
Acceleration from velocity : time graph Acceleration = V - U t
Acceleration from velocity : time graph Acceleration = 3 0 / 2 = 1.5 m/s/s (m.s-2)
Velocity-time graphs Acceleration can be calculated by the gradient of a velocity:time graph. (Remember gradient is the difference up divided by the difference across) 80 Calculate the acceleration for each of the 4 sections of the graph. 60 Velocity m/s 40 20 0 Time/s 10 20 30 40 50
Velocity-time graphs Acceleration can be calculated by the gradient of a velocity:time graph. (Remember gradient is the difference up divided by the difference across) 80 Calculate the acceleration for each of the 4 sections of the graph. Acceleration = V - U t 60 Velocity m/s 40 20 0 Time/s 10 20 30 40 50
Velocity-time graphs Acceleration can be calculated by the gradient of a velocity:time graph. (Remember gradient is the difference up divided by the difference across) 80 Calculate the acceleration for each of the 4 sections of the graph. 60 Velocity m/s 40 20 Acceleration = 40 - 0 = 4m/s2 10 0 Time/s 10 20 30 40 50
Velocity-time graphs Acceleration can be calculated by the gradient of a velocity:time graph. (Remember gradient is the difference up divided by the difference across) 80 Calculate the acceleration for each of the 4 sections of the graph. 60 Velocity m/s 40 20 Acceleration = 0 (no change in velocity) 0 Time/s 10 20 30 40 50
Velocity-time graphs Acceleration can be calculated by the gradient of a velocity:time graph. (Remember gradient is the difference up divided by the difference across) 80 Calculate the acceleration for each of the 4 sections of the graph. 60 Velocity m/s 40 20 Acceleration = 20 - 0 = 2m/s2 10 0 Time/s 10 20 30 40 50
Velocity-time graphs Acceleration can be calculated by the gradient of a velocity:time graph. (Remember gradient is the difference up divided by the difference across) 80 Calculate the acceleration for each of the 4 sections of the graph. 60 Velocity m/s 40 20 Acceleration = 0 - 60 = -3m/s2 20 0 Time/s 10 20 30 40 50


")