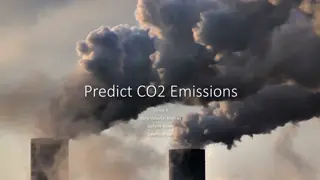
U.S. Energy-Related CO2 Emissions Analysis

This analysis presents U.S. energy-related CO2 emissions projections based on macroeconomic growth and oil price assumptions for various sectors and fuels. The data from AEO2022 outlines historical trends and future scenarios, highlighting the impact of economic growth and oil prices on emissions in different sectors such as transportation, industrial, and electric power generation.

Uploaded on Apr 13, 2025 | 0 Views
Download Presentation

Please find below an Image/Link to download the presentation.
The content on the website is provided AS IS for your information and personal use only. It may not be sold, licensed, or shared on other websites without obtaining consent from the author.If you encounter any issues during the download, it is possible that the publisher has removed the file from their server.
You are allowed to download the files provided on this website for personal or commercial use, subject to the condition that they are used lawfully. All files are the property of their respective owners.
The content on the website is provided AS IS for your information and personal use only. It may not be sold, licensed, or shared on other websites without obtaining consent from the author.
E N D
Presentation Transcript
CO2 emissions based on macroeconomic growth assumptions U.S. energy-related CO2 emissions AEO2022 economic growth cases billion metric tons 2021 6 history projections High Economic Growth 5 Reference Low Economic Growth other cases 4 3 2 1 0 2010 2020 2030 2040 2050 2 Source: U.S. Energy Information Administration, Annual Energy Outlook 2022 (AEO2022) www.eia.gov/aeo
Energy-related CO2 emissions by sector and fuel Energy-related CO2 emissions by sector AEO2022 Reference case billion metric tons Energy-related CO2 emissions by fuel AEO2022 Reference case billion metric tons 2021 2021 3.0 3.0 history projections history projections 2.5 2.5 petroleum 2.0 2.0 transportation natural gas 1.5 1.5 industrial 1.0 1.0 coal electric power 0.5 0.5 residential commercial 0.0 0.0 1990 2000 2010 2020 2030 2040 2050 1990 2000 2010 2020 2030 2040 2050 Note: Series does not include greenhouse gases other than CO2. Industrial sector CO2 emissions do not include process emissions, such as the emissions from cement clinker production. 3 Source: U.S. Energy Information Administration, Annual Energy Outlook 2022 (AEO2022) www.eia.gov/aeo
Energy-related CO2 emissions based on oil price assumptions U.S. energy-related CO2 emissions AEO2022 oil price cases billion metric tons 2021 6 history projections Low Oil Price Reference High Oil Price other cases 5 4 3 2 1 0 2010 2020 2030 2040 2050 4 Source: U.S. Energy Information Administration, Annual Energy Outlook 2022 (AEO2022) www.eia.gov/aeo
Energy-related CO2 emissions by sector based on oil price assumptions CO2 emissions by sector, AEO2022 oil price cases Reference case billion metric tons Low Oil Price case billion metric tons High Oil Price case billion metric tons 2021 2021 2021 2.5 2.5 2.5 history projections history projections history projections 2.0 2.0 2.0 transportation 1.5 1.5 1.5 industrial 1.0 1.0 1.0 electric power 0.5 0.5 0.5 residential commercial 0.0 0.0 0.0 2010 2020 2030 2040 2050 2010 2020 2030 2040 2050 2010 2020 2030 2040 2050 Note: Industrial sector CO2 emissions do not include process emissions, such as the emissions from cement clinker production. 5 Source: U.S. Energy Information Administration, Annual Energy Outlook 2022 (AEO2022) www.eia.gov/aeo
Electric power generation and energy-related CO2 emissions based on oil and natural gas supply assumptions CO2 emissions and electric power generation, AEO2022 oil and natural gas supply cases Renewable electric power generation trillion kilowatthours Fossil fuel-fired electric power generation trillion kilowatthours U.S. energy-related CO2 emissions billion metric tons 2021 2021 2021 6 6 6 history projections history projections history projections 5 5 5 4 4 4 High Oil and Gas Supply Reference Low Oil and Gas Supply other cases 3 3 3 2 2 2 1 1 1 0 0 0 2010 2020 2030 2040 2050 2010 2020 2030 2040 2050 2010 2020 2030 2040 2050 6 Source: U.S. Energy Information Administration, Annual Energy Outlook 2022 (AEO2022) www.eia.gov/aeo
Electric power generation and energy-related CO2 emissions based on renewable cost assumptions CO2 emissions and electric power generation, AEO2022 renewables cost cases Fossil fuel-fired electric power generation trillion kilowatthours 6 history projections Renewable electric power generation trillion kilowatthours U.S. energy-related CO2 emissions billion metric tons 2021 2021 2021 6 6 history projections history projections 5 5 5 4 4 4 High Renewables Cost Reference Low Renewables Cost other cases 3 3 3 2 2 2 1 1 1 0 0 0 2010 2020 2030 2040 2050 2010 2020 2030 2040 2050 2010 2020 2030 2040 2050 7 Source: U.S. Energy Information Administration, Annual Energy Outlook 2022 (AEO2022) www.eia.gov/aeo
CO2 intensity by sector CO2 intensity by end-use sector AEO2022 Reference case metric tons of CO2 per billion British thermal unit 2021 80 history projections 70 transportation 60 50 industrial commercial residential 40 30 20 10 0 1990 2000 2010 2020 2030 2040 2050 Note: Each end-use sector takes into account the carbon intensity of electric power. Industrial sector CO2 emissions do not include process emissions, such as the emissions from cement clinker production. 8 Source: U.S. Energy Information Administration, Annual Energy Outlook 2022 (AEO2022) www.eia.gov/aeo