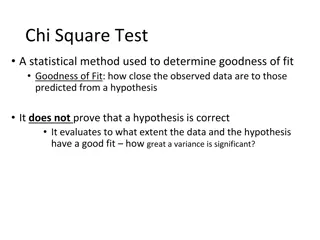
Uji Goodness of Fit Distribusi Multinomial

Distribusi Multinomial merupakan generalisasi dari distribusi binomial dengan memperbolehkan lebih dari 2 hasil yang mungkin. Distribusi ini menghitung probabilitas hasil dari percobaan multinomial. Misalkan ada 3 landas pacu di sebuah airport dengan probabilitas pilihan landas pacu tertentu oleh pesawat yang akan mendarat. Gunakan distribusi multinomial untuk menghitung probabilitas penempatan pesawat secara acak ke landas pacu yang ditentukan.

Download Presentation

Please find below an Image/Link to download the presentation.
The content on the website is provided AS IS for your information and personal use only. It may not be sold, licensed, or shared on other websites without obtaining consent from the author.If you encounter any issues during the download, it is possible that the publisher has removed the file from their server.
You are allowed to download the files provided on this website for personal or commercial use, subject to the condition that they are used lawfully. All files are the property of their respective owners.
The content on the website is provided AS IS for your information and personal use only. It may not be sold, licensed, or shared on other websites without obtaining consent from the author.
E N D
Presentation Transcript
Uji Goodness of Fit : Distribusi Multinomial
Distribusi Multinomial Distribusi Multinomial merupakan generalisasi dari distribusi binomial yaitu dengan melonggarkan kriteria banyaknya hasil (outcome) yang mungkin jadi lebih dari 2. Dalam hal ini maka percobaannya disebut percobaan multinomial sedangkan distribusi probabilitasnya disebut distribusi multinomial.
Definisi: Misalkan tiap percobaan bisa menghasilkan k hasil yang berbeda yaitu E1, E2, ,Ek dan masing-masing dengan probabiliitas p1, p2, ,pk. Distribusi multinomial f(x1,x2, ,xk; n, p1,p2, ..,pk) akan memberikan probabilitas bahwa E1 akan muncul sebanyak x1 kali, E2 akan muncul sebanyak x2 kali, dst dalam pengambilan independen sebanyak n kali, jadi x1+ x2+ .+ xk=n n = kx k x x 2 ( ,..., ; ,..., , ) ... f x x p p n p p p 1 2 1 1 1 k k , ,... x x x 1 2 k dengan p1+p2+ + pk =1 dan
Sebuah airport memiliki 3 buah landas pacu (runway), dan probabilitas sebuah runway dipilih oleh pesawat yg akan mendarat adalah: runway -1 : 2/9 runway -2 : 1/6 runway -3 : 11/18 Berapakah probabilitas 6 pesawat yg datang secara acak di distribusikan ke dalam runway-runway tsb spt berikut: runway -1 : 2 pesawat runway -2 : 1 pesawat runway -3 : 3 pesawat Jawab. Pemilihan runway acak dan independen, dengan p1=2/9, p2=1/6 dan p3=11/18. Probabilitas untuk x1=2, x2= 1 dan x3=3 adalah 6 2 1 11 2 1 11 = = = = = = = = = 2 1 3 ( , 2 , 1 ; 3 , , , ) 6 ( ) ( ) ( ) 1127 . 0 f x x x p p p n 1 2 3 1 2 3 3 , 1 , 2 9 6 18 9 6 18
Contoh Seorang dokter melakukan pengobatan sebanyak 6 kali terhadap 6 orang penderita gagal jantung dengan hasil sembuh sempurna, sembuh dengan gejala sisa, dan meninggal. Berapa besar probabilitas dari 6 kali pengobatan tersebut menghasilkan 2 orang sembuh sempurna, 2 orang sembuh dengan gejala sisa, dan 2 orang meninggal. 6! n! p = (P1r1)(P1r1) (P1r1) p = (1/3)2 (1/3)2(1/3)2 r1!r2r3! 2! 2! 2! P = 0,123 = 12,3%
Contoh Berdasarkan teori genetika, perbandingan seekor hamster betina akan melahirkan anak dgn warna bulu merah,hitam dan putih adalah 8:4:4. Hitung peluang akan lahir anak dgn warna merah 5 ekor, hitam 2 ekor, putih 1 ekor dari kelahiran 8 ekor. 5 2 5 3 = 8 4 4 8 4 4 8! 8 5!2!1! 16 4 1 4 168 256 8 = = = = 5,2,1; , , 168 0,656 f 5 2 8 4 16 16 16 16 16 16 5,2,1
Uji Goodness of Fit Uji Goodness of Fit Bagaimana dekat hasil pengamatan/sampel sesuai dengan yang diharapkan ? Example: In tossing a coin, you expect half heads and half tails. You tossed a coin 100 times. You expected 50 heads and 50 tails. However, you obtained 48 heads and 52 tails. Are 48 heads and 52 tails close enough to call the coin fair?
Uji Hipotesis untuk proporsi dari Populasi Multinomial 1. Nyatakan Hipotesis nol dan hipotesis alternatifnya. 2. Ambil sampel random dan tentukan frekuensi pengamatan, fi , untuk masing-masing k kategori. 3. Dengan menganggap H0 benar, frekuensi harapan ei dihitung untuk tiap kategori yaitu dengan mengalikan tiap kategori dengan probabilitas tiap kategori dengan ukuran sampel (sample size).
Uji Hipotesis untuk proporsi dari Populasi Multinomial 4. Hitung statistik uji 2 e ( ) f e k 2 = i i = i 1 i dengan fi = frekuensi pengamatan untuk kategori i ei = frekuensi harapan untuk i k = banyak kategori Catatan : Statistik mempunyai distribusi chi-kuadrat dengan derajat bebas k 1 asalkan frekuensi harapan untuk semua kategori lebih dari 5.
Uji Hipotesis untuk proporsi dari Populasi Multinomial 5. Aturan Penolakan Reject H0 if p-value < p-value approach: 2 2 Critical value approach: Reject H0 if dengan adalah tingkat signifikansi dan distribusinya adalah distribusi chi-kuadrat dengan derajat bebas k 1.
Multinomial Distribution Goodness of Fit Test Example: Finger Lakes Homes (A) Finger Lakes Homes manufactures four models of prefabricated homes, a two-story colonial, a log cabin, a split-level, and an A-frame. To help in production planning, management would like to determine if previous customer purchases indicate that there is a preference in the style selected.
Multinomial Distribution Goodness of Fit Test Example: Finger Lakes Homes (A) The number of homes sold of each model for 100 sales over the past two years is shown below. Split- A- Model Colonial Log Level Frame # Sold 30 20 35 15
Multinomial Distribution Goodness of Fit Test Hypotheses H0: pC = pL = pS = pA = .25 Ha: The population proportions are not pC = .25, pL = .25, pS = .25, and pA = .25 where: pC = population proportion that purchase a colonial pL = population proportion that purchase a log cabin pS = population proportion that purchase a split-level pA = population proportion that purchase an A-frame
Hypotheses Ho : There is no preference in the home styles or all home styles have equal preferences. Ha : All home styles do not have equal preferences.
Multinomial Distribution Goodness of Fit Test Rejection Rule Reject H0 if p-value < .05 or 2 > 7.815. With = .05 and k - 1 = 4 - 1 = 3 degrees of freedom Do Not Reject H0 Reject H0 2 7.815
Multinomial Distribution Goodness of Fit Test Expected Frequencies e1 = .25(100) = 25 e2 = .25(100) = 25 e3 = .25(100) = 25 e4 = .25(100) = 25 Test Statistic 2 2 2 2 ( 30 25 25 ) ( 20 25 25 ) ( 35 25 25 ) ( 15 25 25 ) 2 = + + + = 1 + 1 + 4 + 4 = 10
Multinomial Distribution Goodness of Fit Test Conclusion Using the p-Value Approach Area in Upper Tail .10 .05 .025 .01 .005 2 Value (df = 3) 6.251 7.815 9.348 11.345 12.838 Because 2 = 10 is between 9.348 and 11.345, the area in the upper tail of the distribution is between .025 and .01. The p-value < . We can reject the null hypothesis. Note: A precise p-value can be found using R.
Multinomial Distribution Goodness of Fit Test Conclusion Using the Critical Value Approach 2 = 10 > 7.815 We reject, at the .05 level of significance, the assumption that there is no home style preference.
Solusi dengan SPSS Sesudah mengimputkan data dalam bentuk frekuensi pengamatan seperti di samping selanjutnya digunakan perintah Analyze Non Parametrik Statistik Chi-square
Output SPSS : Dari output SPSS diperoleh X2 = 10 dengan nilai-p = 0.019 sehingga Ho ditolak artinya distribusinya tidak seragam diskrit (homogen).


, dan")