UK 100,000 Genomes Project: Views, Expectations, and Experiences
The UK 100,000 Genomes Project aims to sequence genomes of NHS patients to enable scientific discovery and kick-start the genomics industry in the UK. Patients go through a consent process and participate in surveys and interviews to understand their views and experiences. Findings show positive trust, reciprocity, altruism, and hope among participants, but highlight a lack of informed consent due to poor understanding of genetics and processes involved.

Download Presentation

Please find below an Image/Link to download the presentation.
The content on the website is provided AS IS for your information and personal use only. It may not be sold, licensed, or shared on other websites without obtaining consent from the author.If you encounter any issues during the download, it is possible that the publisher has removed the file from their server.
You are allowed to download the files provided on this website for personal or commercial use, subject to the condition that they are used lawfully. All files are the property of their respective owners.
The content on the website is provided AS IS for your information and personal use only. It may not be sold, licensed, or shared on other websites without obtaining consent from the author.
E N D
Presentation Transcript
Statistical Genomics Lecture 8: Genetic architecture and simulation of phenotype Zhiwu Zhang Washington State University
Administration Homework 2, due Feb 17, Wednesday, 3:10PM Office hour: Monday, 1:30-2:30 Midterm exam: February 26, Friday, 50 minutes (3:35- 4:25PM), 25 questions. Final exam: May 3, 120 minutes (3:10-5:10PM) for 50 questions.
Outline Accumulation of gene effect Genetic architecture Gene effect distribution Phenotype distribution Heritability R function
How phenotypes get normal distributed? p=0.5, Left-fail Right-success x~B(n, p) n trials each with p successful rate. The total number of successes is a random variable, x x=rbinom(10000,5,.0) 1 Gene 1 Gene 2 2 1 1 Gene 3 3 1 1 3 Gene 4 4 4 1 6 1 Gene 5 1 5 5 9 1 9 Even genes have the same effect 4 1 3 0 5 2 Outcome
quartz() #Mac par(mfrow=c(4,4),mar = c(3,4,1,1)) n=10000 m=10 x=rbinom(n,m,.5) hist(x) plot(density(x))
Histogram of y Ten gens with same effect density.default(x = y) Histogram of y density.default(x = y) 2500 2500 0.0 0.1 0.2 0.3 0.4 0.0 0.1 0.2 0.3 0.4 Frequency Frequency 1500 1500 Density Density 500 500 0 0 0 2 4 6 8 10 0 2 4 6 8 0 2 4 6 8 10 0 2 4 6 8 Histogram of y density.default(x = y) Histogram of y density.default(x = y) 2500 2500 0.0 0.1 0.2 0.3 0.4 0.0 0.1 0.2 0.3 0.4 Frequency Frequency 1500 1500 Density Density 500 500 0 0 0 2 4 6 8 10 0 2 4 6 8 0 2 4 6 8 10 0 2 4 6 8 Histogram of y density.default(x = y) Histogram of y density.default(x = y) 2500 2500 0.0 0.1 0.2 0.3 0.4 0.4 Frequency Frequency 1500 1500 Density Density 0.2 500 500 0.0 0 0 0 2 4 6 8 10 0 2 4 6 8 0 2 4 6 8 10 0 2 4 6 8 Histogram of y density.default(x = y) Histogram of y density.default(x = y) 2500 2500 0.0 0.1 0.2 0.3 0.4 0.4 Frequency Frequency 1500 1500 Density Density 0.2 500 500 0.0 0 0 0 2 4 6 8 10 0 2 4 6 8 0 2 4 6 8 10 0 2 4 6 8
Ten gens with different effect Gene effect Assign to individuals Uniform random variable Individual gene effect Individual total effect
Ten gens with different effects #x=rep(1,m) x=runif(m) gene=matrix(x,n,m,byrow = T) head(gene) galton=matrix(runif(n*m),n,m) head(galton) galton.binary=galton<.5 head(galton.binary) gene[galton.binary]=0 head(gene) y=rowSums(gene) y[1:6] hist(y) plot(density(y))
Ten gens with different effects Histogram of y density.default(x = y) Histogram of y 0.4 density.default(x = y) 0.0 0.1 0.2 0.3 0.4 1500 0.3 1500 Frequency Frequency Density Density 0.2 500 0.1 500 0.0 0 0 0 1 2 3 4 5 0 1 2 3 4 5 0 1 2 3 4 5 0 1 2 3 4 5 6 Histogram of y density.default(x = y) Histogram of y density.default(x = y) 0.4 0.4 800 1500 Frequency Frequency Density Density 0.2 400 0.2 500 0.0 0.0 0 0 0 1 2 3 0 1 2 3 4 0 1 2 3 4 0 1 2 3 4 Histogram of y 0.4density.default(x = y) Histogram of y density.default(x = y) 0.4 1500 0.3 1500 Frequency Frequency Density Density 0.2 0.2 500 0.1 500 0.0 0.0 0 0 0 1 2 3 4 5 0 1 2 3 4 5 0 1 2 3 4 0 1 2 3 4 Histogram of y 0.30density.default(x = y) Histogram of y 0.4density.default(x = y) 1500 1500 0.3 Frequency Frequency 1000 0.20 Density Density 0.2 500 0.10 500 0.1 0.00 0.0 0 0 0 1 2 3 4 5 6 0 2 4 6 0 1 2 3 4 5 0 1 2 3 4 5 6
Histogram of y density.default(x = y) Histogram of y density.default(x = y) 2500 2500 Histogram of y density.default(x = y) Histogram of y 0.4 density.default(x = y) 10 genes 0.0 0.1 0.2 0.3 0.4 0.0 0.1 0.2 0.3 0.4 0.0 0.1 0.2 0.3 0.4 Frequency Frequency 1500 1500 1500 Density Density 0.3 1500 Frequency Frequency Density Density 0.2 500 500 500 0.1 500 0 0 0.0 0 0 0 2 4 6 8 10 0 2 4 6 8 0 2 4 6 8 10 0 2 4 6 8 0 1 2 3 4 5 0 1 2 3 4 5 0 1 2 3 4 5 0 1 2 3 4 5 6 Histogram of y 10000 Ba d idth density.default(x = y) Histogram of y 10000 Ba d idth density.default(x = y) N 0 212 N 0 212 2500 2500 Histogram of y 10000 Ba d idth density.default(x = y) Histogram of y 10000 Ba d idth density.default(x = y) N 0 120 N 0 131 0.0 0.1 0.2 0.3 0.4 0.0 0.1 0.2 0.3 0.4 0.4 Frequency Frequency 1500 1500 Density Density 0.4 800 1500 Frequency Frequency Density Density 0.2 500 500 400 0.2 500 0 0 0.0 0.0 0 0 0 2 4 6 8 10 0 2 4 6 8 0 2 4 6 8 10 0 2 4 6 8 0 1 2 3 0 1 2 3 4 0 1 2 3 4 0 1 2 3 4 Histogram of y 10000 Ba d idth density.default(x = y) Histogram of y 10000 Ba d idth density.default(x = y) N 0 212 N 0 212 2500 2500 Histogram of y N 0.4density.default(x = y) Histogram of y 10000 Ba d idth density.default(x = y) 10000 Ba d idth 0 100 N 0 115 0.0 0.1 0.2 0.3 0.4 0.4 Frequency Frequency 1500 1500 0.4 1500 Density Density 0.3 1500 Frequency Frequency 0.2 Density Density 0.2 0.2 500 500 500 0.1 500 0.0 0 0 0.0 0.0 0 0 0 2 4 6 8 10 0 2 4 6 8 0 2 4 6 8 10 0 2 4 6 8 0 1 2 3 4 5 0 1 2 3 4 5 0 1 2 3 4 0 1 2 3 4 Histogram of y 10000 Ba d idth density.default(x = y) Histogram of y 10000 Ba d idth density.default(x = y) N 0 212 N 0 212 2500 2500 Histogram of y N 0.30density.default(x = y) Histogram of y N 0.4density.default(x = y) 10000 Ba d idth 0 130 10000 Ba d idth 0 118 0.0 0.1 0.2 0.3 0.4 0.4 1500 Frequency Frequency 1500 1500 1500 Density Density 0.3 Frequency Frequency 1000 0.2 0.20 Density Density 0.2 500 500 500 0.10 500 0.1 0.0 0 0 0.00 0.0 0 0 0 2 4 6 8 10 0 2 4 6 8 0 2 4 6 8 10 0 2 4 6 8 0 1 2 3 4 5 6 0 2 4 6 0 1 2 3 4 5 0 1 2 3 4 5 6 Histogram of x 0.08 density.default(x = x) Histogram of x 0.08density.default(x = x) Histogram of y 0.08 density.default(x = y) Histogram of y 0.08density.default(x = y) 100 genes 1500 1500 1500 1500 1000 Frequency Frequency Frequency Frequency 1000 1000 1000 Density Density Density Density 0.04 0.04 0.04 0.04 500 500 500 500 0.00 0.00 0.00 0.00 0 0 0 0 30 40 50 60 30 40 50 60 70 30 40 50 60 70 30 40 50 60 70 35 45 55 65 30 40 50 60 70 30 40 50 60 30 40 50 60 70 Histogram of x N 0.08density.default(x = x) Histogram of x N 0.08 density.default(x = x) Histogram of y N 0.08 density.default(x = y) Histogram of y N 0.08density.default(x = y) 10000 Ba d idth 0 638 10000 Ba d idth 0 717 10000 Ba d idth 0 638 10000 Ba d idth 0 638 1500 1500 1500 1500 1000 1000 Frequency Frequency Frequency Frequency 1000 1000 Density Density Density Density 0.04 0.04 0.04 0.04 500 500 500 500 0.00 0.00 0.00 0.00 0 0 0 0 30 40 50 60 30 40 50 60 70 30 40 50 60 70 30 40 50 60 70 35 45 55 65 30 40 50 60 70 40 50 60 70 30 40 50 60 70 Histogram of x N 0.08density.default(x = x) Histogram of x N 0.08density.default(x = x) Histogram of y N 0.08density.default(x = y) Histogram of y N 0.08density.default(x = y) 10000 Ba d idth 0 638 10000 Ba d idth 0 638 10000 Ba d idth 0 638 10000 Ba d idth 0 638 1500 1500 1500 2500 1000 1000 1000 Frequency Frequency Frequency Frequency Density Density Density Density 0.04 0.04 0.04 0.04 500 500 500 1000 0.00 0.00 0.00 0.00 0 0 0 0 30 50 70 30 50 70 30 40 50 60 70 30 40 50 60 70 30 40 50 60 70 30 40 50 60 70 35 45 55 65 40 50 60 70 Histogram of x N 0.08density.default(x = x) Histogram of x N 0.08density.default(x = x) Histogram of y N 0.08density.default(x = y) Histogram of y N 0.08density.default(x = y) 10000 Ba d idth 0 638 10000 Ba d idth 0 730 10000 Ba d idth 0 638 10000 Ba d idth 0 638 1500 1500 1500 1500 1000 1000 1000 1000 Frequency Frequency Frequency Frequency Density Density Density Density 0.04 0.04 0.04 0.04 500 500 500 500 0.00 0.00 0.00 0.00 0 0 0 0 40 50 60 70 30 40 50 60 70 30 40 50 60 30 40 50 60 70 30 40 50 60 70 30 40 50 60 70 30 40 50 60 30 40 50 60 70 Same effect Different effects
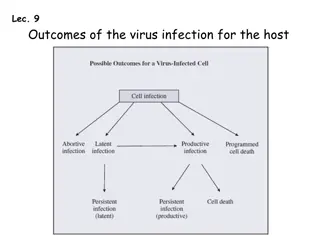
Complex traits Controlled by multiple genes Influenced by environment Also known as quantitative traits Most traits are continuous, e.g. yield and height, Some are categorical, e.g. node number, score of disease resistance Some binary traits are still quantitative traits, e.g. diabetes Economically important
Dissecting phenotype Y= G + E + GxE + Residual G = Additive + Dominance + Epistasis E: Environment, e.g. year and location Residual: e.g. measurement error
QTL and QTN Quantitative Trait Loci (QTL) Specific regions in the genome that are associated with quantitative traits The regions were traditionally considered as 10-15 cM. The regions evolved to 3-5 cM in fine mapping. Suppose maize genome contains 50,000 genes and has genetic map =1700 cM Each QTL we identify has roughly 100-150 genes Gene cloning: identification the QTL regions at gene level Ultimate goal: functional mutations Quantitative Trait Nucleotide: QTN
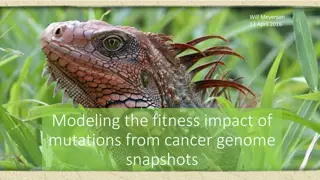
Gene effects Flowering time is controled by >50 genes Most have small effects The largest one only 1.5 increase days Buckler et al, Science, 2009
Distribution of QTN effect Normal distribution Geometry distribution
Theoretical geometric distribution The probability distribution of the number X of Bernoulli trials needed to get one success Prob (X=k)=(1-p)k-1 p
Approximated geometric distribution Effect(X=k)=pk
Genotype in Numeric format myGD=read.table(file="http://zzlab.net/GAPIT/data/mdp_numeric.txt",head=T)
Genetic map myGM=read.table(file="http://zzlab.net/GAPIT/data/mdp_SNP_information.txt",head=T)
Sampling QTNs #Sampling QTN NQTN=10 X=myGD[,-1] n=nrow(X) m=ncol(X) QTN.position=sample(m,NQTN,replace=F) SNPQ=as.matrix(X[,QTN.position]) QTN.position head(SNPQ)
QTN positions plot(myGM[,c(2,3)]) lines(myGM[QTN.position,c(2,3)],type="p",col="red") points(myGM[QTN.position,c(2,3)],type="p",col="blue",cex = 5) 3.0e+08 1.5e+08 Position 0.0e+00 2 4 6 8 10 Chromosome
Additive genetic effect addeffect=rnorm(NQTN,0,1) addeffect effect=SNPQ%*%addeffect head(effect)
genetic effect distribution Histogram of effect 8 80 6 60 Frequency 4 effect 40 par(mfrow=c(2,2)) plot(effect) hist(effect) boxplot(effect) plot(ecdf(effect)) 2 20 0 -2 0 0 50 100 200 -2 0 2 4 6 8 Index effect ecdf(effect) 0.0 0.2 0.4 0.6 0.8 1.0 8 6 4 Fn(x) 2 0 -2 -4 -2 0 2 4 6 8 x
Residual h2=.7 effectvar=var(effect ) effectvar residualvar=(effectvar-h2*effectvar)/h2 residualvar residual=rnorm(n,0,sqrt(residualvar)) head(residual)
Residual distribution Histogram of residual 4 80 2 Frequency 60 residual 0 40 par(mfrow=c(2,2)) plot(residual) hist(residual) boxplot(residual) plot(ecdf(residual)) 20 -2 0 0 50 100 200 -4 -2 0 2 4 Index residual ecdf(residual) 0.0 0.2 0.4 0.6 0.8 1.0 4 2 Fn(x) 0 -2 -4 -2 0 2 4 x
Phenotype Histogram of y 10 50 8 40 6 Frequency 30 4 y 2 20 0 y=effect+residual par(mfrow=c(2,2)) plot(y) hist(y) boxplot(y) plot(ecdf(y)) 10 -2 0 0 50 100 150 200 250 -4 -2 0 2 4 6 8 10 Index y ecdf(y) 10 1.0 8 0.8 6 0.6 Fn(x) 4 0.4 2 0 0.2 -2 0.0 -5 0 5 10 x
Heritability va=var(effect) ve=var(residual) vp=var(y) v=matrix(c(va,ve,vp),1,3) colnames(v)=c("A", "E","P") barplot(v,col="gray") density.default(x = y) 5 0.5 plot(density(y),ylim=c(0,.5)) lines(density(effect),col="blue") lines(density(residual),col="red") 0.4 4 0.3 3 Density 0.2 2 0.1 1 0.0 0 A E P -5 0 5 10 N = 281 Bandwidth = 0.6275
Correlations #Plot par(mfrow=c(1,3),mar = c(30,4,10,1)) plot(y,effect) plot(y,residual) plot(residual,effect) cor(y,effect)
How to do this again and again? Function
G2P=function(X,h2,alpha,NQTN,distribution){ n=nrow(X) m=ncol(X) Function to simulate phenotypes #Sampling QTN QTN.position=sample(m,NQTN,replace=F) SNPQ=as.matrix(X[,QTN.position]) QTN.position #QTN effects if(distribution=="norm") {addeffect=rnorm(NQTN,0,1) }else {addeffect=alpha^(1:NQTN)} #Simulate phenotype effect=SNPQ%*%addeffect effectvar=var(effect) residualvar=(effectvar-h2*effectvar)/h2 residual=rnorm(n,0,sqrt(residualvar)) y=effect+residual return(list(addeffect = addeffect, y=y, add = effect, residual = residual, QTN.position=QTN.position, SNPQ=SNPQ)) }
Load R function source('~/Dropbox/Current/ZZLab/WSUCourse/CROPS545/Demo/G2P.R')
source('~/Dropbox/Current/ZZLab/WSUCourse/CROPS545/Demo/G2P.R')source('~/Dropbox/Current/ZZLab/WSUCourse/CROPS545/Demo/G2P.R') par(mfrow=c(3,1),mar = c(3,4,1,1)) myG2P=G2P(X,.75,1,10,"norm") str(myG2P) va=var(myG2P$add) ve=var(myG2P$residual) vp=var(myG2P$y) v=matrix(c(va,ve,vp),1,3) colnames(v)=c("A", "E","P") barplot(v,col="gray") 5 4 3 2 1 0 A E P 15 va myG2P=G2P(X,.5,1,10,"norm") va=var(myG2P$add) ve=var(myG2P$residual) vp=var(myG2P$y) v=matrix(c(va,ve,vp),1,3) colnames(v)=c("A", "E","P") barplot(v,col="gray") decreases with decreasing h2 10 5 0 A E P myG2P=G2P(X,.25,1,10,"norm") va=var(myG2P$add) ve=var(myG2P$residual) vp=var(myG2P$y) v=matrix(c(va,ve,vp),1,3) colnames(v)=c("A", "E","P") barplot(v,col="gray") 10 8 6 4 2 0 A E P
density.default(x = myG2P$y) 1.5 Effect of Number of Genes 1.0 Density 0.5 0.0 -6 -4 -2 0 2 N = 281 Bandwidth = 0.3934 #Desect phenotype par(mfrow=c(3,1)) myG2P=G2P(X,.5,1,2,"norm") plot(density(myG2P$y),ylim=c(0,1.5)) lines(density(myG2P$add),col="blue") lines(density(myG2P$residual),col="red") density.default(x = myG2P$y) 0.30 0.20 Density 0.10 0.00 -5 0 5 10 15 myG2P=G2P(X,.5,1,10,"norm") plot(density(myG2P$y),ylim=c(0,.3)) lines(density(myG2P$add),col="blue") lines(density(myG2P$residual),col="red") N = 281 Bandwidth = 0.7383 density.default(x = myG2P$y) 0.08 Density myG2P=G2P(X,.5,1,100,"norm") plot(density(myG2P$y),ylim=c(0,.1)) lines(density(myG2P$add),col="blue") lines(density(myG2P$residual),col="red") 0.04 0.00 -20 0 20 40 60 N = 281 Bandwidth = 3.442
Effect of Number of Genes Histogram of myG2P$add 120 Histogram of myG2P$residu Histogram of myG2P$y 50 #Check on distribution par(mfrow=c(3,3),mar = c(3,4,1,1)) myG2P=G2P(X,.5,1,2,"norm") hist(myG2P$add) hist(myG2P$residual) hist(myG2P$y) 60 Frequency Frequency Frequency 80 40 30 40 20 10 0 0 0 -0.5 0.5 1.5 -2 -1 0 1 2 -2 0 1 2 3 4 Histogram of myG2P$add 60 Histogram of myG2P$residu Histogram of myG2P$y 80 50 Frequency Frequency 60 Frequency myG2P=G2P(X,.5,1,10,"norm") hist(myG2P$add) hist(myG2P$residual) hist(myG2P$y) 40 30 40 20 20 10 0 0 0 -4 0 4 8 -10 -5 0 5 10 -5 0 5 10 Histogram of myG2P$add Histogram of myG2P$residu Histogram of myG2P$y 60 60 80 myG2P=G2P(X,.5,1,100,"norm") hist(myG2P$add) hist(myG2P$residual) hist(myG2P$y) Frequency Frequency Frequency 60 40 40 40 20 20 20 0 0 0 -30 -10 10 -30 -10 10 -60 -20 20
Check on gene effect distribution Histogram of myG2P$add Histogram of myG2P$residu 50 Histogram of myG2P$y #Check gene effect distribution par(mfrow=c(3,3),mar = c(3,4,1,1)) myG2P=G2P(X,.5,1,10,"geom") hist(myG2P$add) hist(myG2P$residual) hist(myG2P$y) 60 60 40 Frequency Frequency Frequency 30 40 40 20 20 20 10 0 0 0 4 6 8 12 16 -6 -2 2 6 0 5 10 15 Histogram of myG2P$add 80 Histogram of myG2P$residu Histogram of myG2P$y 40 50 60 myG2P=G2P(X,.5,.95,10,"geom") hist(myG2P$add) hist(myG2P$residual) hist(myG2P$y) Frequency Frequency Frequency 30 40 30 20 20 10 0 10 0 0 4 6 8 10 14 -4 0 2 4 6 5 10 15 Histogram of myG2P$add Histogram of myG2P$residu 80 Histogram of myG2P$y 120 myG2P=G2P(X,.5,.5,10,"geom") hist(myG2P$add) hist(myG2P$residual) hist(myG2P$y) 80 60 Frequency Frequency Frequency 80 60 40 40 40 20 20 0 0 0 0.0 1.0 2.0 -1.0 0.0 1.0 -0.5 0.5 1.5 2.5
Highlight Accumulation of gene effect Genetic architecture Gene effect distribution Phenotype distribution Heritability R function


 #Mac")


{")

")
")