Ultrasonic Range Finder
Concept of using data to describe motion in this intriguing lesson. Discover how to calculate speed, interpret graphs, and analyze movement patterns. Enhance your understanding of ultrasonic range finders and storytelling through visual aids and practical examples.
Download Presentation

Please find below an Image/Link to download the presentation.
The content on the website is provided AS IS for your information and personal use only. It may not be sold, licensed, or shared on other websites without obtaining consent from the author.If you encounter any issues during the download, it is possible that the publisher has removed the file from their server.
You are allowed to download the files provided on this website for personal or commercial use, subject to the condition that they are used lawfully. All files are the property of their respective owners.
The content on the website is provided AS IS for your information and personal use only. It may not be sold, licensed, or shared on other websites without obtaining consent from the author.
E N D
Presentation Transcript
Ultrasonic Range Finder Lesson 4 - How can we use data to describe movement?
STORYTELLING 1. How far did Christopher s car travel between points A and B? 1. How much time did it take for Christopher to travel from point A to point B? FINDER RANGE 1. Describe the motion of Christopher s car between points B and C. 1. What is the speed of the car between points A and B? 2
STORYTELLING 1. What do the labels tell us? 1. What do you think is happening in the graph? FINDER RANGE 1. How can you tell? 3
STORYTELLING 1. What do the labels tell us? 1. What do you think is happening in the graph? FINDER RANGE 1. How can you tell? 4
STORYTELLING 1. What do the labels tell us? 1. What do you think is happening in the graph? FINDER RANGE 1. How can you tell? 5
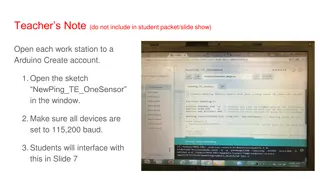
STORYTELLING 1. Open New Piper Project 1. View data. FINDER RANGE 1. Follow the directions in your Graphic Organizer. 6
EXTENSION DISTANCE DISTANCE FINDER RANGE TIME TIME How can we calculate speed? 7
EXTENSION How can we calculate speed? y y y FINDER RANGE x x x A steep line indicates a fast speed A shallow graph indicates a slow speed A flat line indicates zero speed, the object is stationary 8
Where does the line have a steep slope? SLOPE What happened here? Distance travelled = 4 miles Time travelled = 1 hour FINDER RANGE Where does the line have a shallow slope? Distance travelled = 1 mile SLOPE = distance covered time Time travelled = 1 hour 9
REFLECT! Respond to these writing prompts: 1. How do waves help you experience the world around you? FINDER RANGE 1. How do graphs help us describe situations in our lives? 10
