Uncertainty Analysis for Engineers: Summarizing Statistical Data Metrics
In this informative content, essential statistical data metrics such as central tendency, dispersion, and shape are explored in the context of uncertainty analysis for engineers. Topics covered include mean, median, mode, variance, skewness, kurtosis, and more. The discussion delves into techniques for summarizing and interpreting data, with examples involving dice rolls and radioactive decay. Additionally, the calculation of expected values and moments of distributions are elucidated, offering valuable insights for engineers navigating uncertainty in their analyses.

Download Presentation

Please find below an Image/Link to download the presentation.
The content on the website is provided AS IS for your information and personal use only. It may not be sold, licensed, or shared on other websites without obtaining consent from the author.If you encounter any issues during the download, it is possible that the publisher has removed the file from their server.
You are allowed to download the files provided on this website for personal or commercial use, subject to the condition that they are used lawfully. All files are the property of their respective owners.
The content on the website is provided AS IS for your information and personal use only. It may not be sold, licensed, or shared on other websites without obtaining consent from the author.
E N D
Presentation Transcript
Summary Statistics Jake Blanchard Spring 2008 Uncertainty Analysis for Engineers 1
Summarizing and Interpreting Data It is useful to have some metrics for summarizing statistical data (both input and output) 3 key characteristics are central tendency (mean, median, mode) Dispersion (variance) Shape (skewness, kurtosis) Uncertainty Analysis for Engineers 2
Central Tendency Mean n = i = = ( ) ( ) ( ) E x x p E x x f x dx i i 1 Median=point such that exactly half of the probability is associated with lower values and half with greater values z = ( ) 5 . 0 f x dx Mode=most likely value (maximum of pdf) Uncertainty Analysis for Engineers 3
For 1 Dice mean 6 1 1 1 1 1 1 = x = + + + + + ( ) ( ) 1 2 3 4 5 6 E x x p x i i 6 6 6 6 6 6 = 1 i = ( ) 5 . 3 E x median = 5 . 3 e x = mod 5 . 3 Uncertainty Analysis for Engineers 4
Radioactive Decay For our example, the mean, median, and mode are given by mean 1 = = t = t ( ) ( ) E t tf t dt e dt 0 median z = t 5 . 0 e dt 0 ln( ) 2 = z The mode is x=0 Uncertainty Analysis for Engineers 5
Other Characteristics We can calculate the expected value of any function of our random variable as ( ) ( ) h x f x dx ( ) x = E h ( ) ( ) i p x i h x i Uncertainty Analysis for Engineers 6
Some Results = ) ( ) E c c = ( ( ) E cx cE x ( ) x n n = j = j = E x E j j 1 1 ( ) x n n = j = j = E b x b E j j j j 1 1 Uncertainty Analysis for Engineers 7
Moments of Distributions We can define many of these parameters in terms of moments of the distribution = 1 ( ) x f x dx ( ) k ( ) x f x dx 1 k = = E x 1 k ( ) i k ( ) x p x 1 i i Mean is first moment. Variance is second moment Third and fourth moments are related to skewness and kurtosis Uncertainty Analysis for Engineers 8
Spread (Variance) Variance is a measure of spread or dispersion = = = x E 1 2 ( ) 2 2 2 ( ) x f x dx 1 For discrete data sets, the biased variance is: ( = i n 1 1 n ) 2 = 2 s x x and the unbiased variance is 1 n ( ) = i 2 = 2 s x x 1 n 1 The standard deviation is the square root of the variance Uncertainty Analysis for Engineers 9
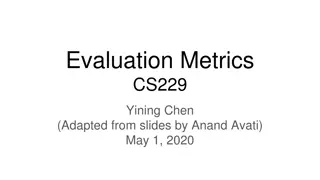
Skewness skewness is a measure of asymmetry = = x E 1 3 ( ) 3 3 ( ) x f x dx 1 For discrete data sets, the biased skewness is related to: = m 3 1 n ( ) = i 3 x x n 1 The skewness is often defined as = 3 1 3 Uncertainty Analysis for Engineers 10
Skewness Uncertainty Analysis for Engineers 11
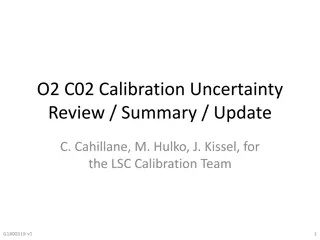
Kurtosis kurtosis is a measure of peakedness = x E 4 ( ) 4 4 = ( ) x f x dx 1 1 For discrete data sets, the biased kurtosis is related to: = i n 1 1 n ( ) 4 = m x x 4 The kurtosis is often defined as = 3 4 2 4 Uncertainty Analysis for Engineers 12
Kurtosis Pdf of Pearson type VII distribution with kurtosis of infinity (red), 2 (blue), and 0 (black) Uncertainty Analysis for Engineers 13
Using Matlab Sample data is length of time a person was able to hold their breath (40 attempts) Try a scatter plot load RobPracticeHolds; y = ones(size(breathholds)); h1 = figure('Position',[100 100 400 100],'Color','w'); scatter(breathholds,y); Uncertainty Analysis for Engineers 14
Adding Information disp(['The mean is ',num2str(mean(breathholds)),' seconds (green line).']); disp(['The median is ',num2str(median(breathholds)),' seconds (red line).']); hold all; line([mean(breathholds) mean(breathholds)],[0.5 1.5],'color','g'); line([median(breathholds) median(breathholds)],[0.5 1.5],'color','r'); Uncertainty Analysis for Engineers 15
Box Plot title('Scatter with Min, 25%iqr, Median, Mean, 75%iqr, & Max lines'); xlabel(''); h3 = figure('Position',[100 100 400 100],'Color','w'); boxplot(breathholds,'orientation','horizontal','widths',.5); set(gca,'XLim',[40 140]); title('A Boxplot of the same data'); xlabel(''); set(gca,'Yticklabel',[]); ylabel(''); Uncertainty Analysis for Engineers 16
Box Plot Min Box represents inter-quartile range (half of data) Median Max Outlier Uncertainty Analysis for Engineers 17
Empirical cdf h3 = figure('Position',[100 100 600 400],'Color','w'); cdfplot(breathholds); Uncertainty Analysis for Engineers 18
Multivariate Data Sets When there are multiple input variables, we need some additional ways to characterize the data ( , ) ( , ) h x y f x y dxdy continuous = ( , ) E h x y ( ) ( , ) , h x y p x y discrete i j i j i j = ( , ) ( ) ( ) ( ) Cov x y E xy E x E y If x and y are independent, then Cov(x,y)=0 Uncertainty Analysis for Engineers 19
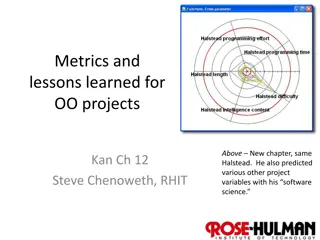
Correlation Coefficients Two random variables may be related Define correlation coefficient of input (x) and output (y) as ( ( ) 1 x x k k = )( ) m x x y y ( , ) Cov x y k k = = = 1 k , x y ( ) ( ) ( ) x y m m 2 2 y y k = 1 k =1 implies linear dependence, positive slope =0 no dependence =-1 implies linear dependence, negative slope Uncertainty Analysis for Engineers 20
Example =0.98 =1 =-0.38 =-0.98 Uncertainty Analysis for Engineers 21
Example x=rand(25,1)-0.5; y=x; corrcoef(x,y) subplot(2,2,1), plot(x,y,'o') y2=x+0.2*rand(25,1); corrcoef(x,y2) subplot(2,2,2), plot(x,y2,'o') y3=-x+0.2*rand(25,1); corrcoef(x,y3) subplot(2,2,3), plot(x,y3,'o') y4=rand(25,1)-0.5; corrcoef(x,y4) subplot(2,2,4), plot(x,y4,'o') Uncertainty Analysis for Engineers 22


")