Understanding Acceleration and Motion Concepts Through Examples and Experiments
Explore the concept of acceleration with practical examples and experiments. Learn how to measure acceleration, analyze velocity changes, and apply this knowledge to real-world scenarios. Get ready to delve into the exciting world of motion physics!

Download Presentation

Please find below an Image/Link to download the presentation.
The content on the website is provided AS IS for your information and personal use only. It may not be sold, licensed, or shared on other websites without obtaining consent from the author. If you encounter any issues during the download, it is possible that the publisher has removed the file from their server.
You are allowed to download the files provided on this website for personal or commercial use, subject to the condition that they are used lawfully. All files are the property of their respective owners.
The content on the website is provided AS IS for your information and personal use only. It may not be sold, licensed, or shared on other websites without obtaining consent from the author.
E N D
Presentation Transcript
Learning Intention: To develop a knowledge of acceleration, and how it can be used to describe the motion of an object. Success Criteria: An experiment to measure acceleration will be successfully completed. This knowledge will also lead into future areas of work, such as velocity-time graphs.
Car A can go from 0 to 100 km/h in 4.5 s, and has a top speed of 350 km/h. Car B goes from 0 to 100 km/h in 6.5 s, and has a top speed of 500 km/h. Which car is the fastest?
Click the picture above for a drag race. Which car has the biggest acceleration?
Click the picture above for a race between Cristiano Ronaldo and a Bugatti Veyron. Who will win?
ACCELERATION Acceleration is defined as the change in velocity per unit time. Final Velocity (m/s) Initial Velocity (m/s) a = v u t Acceleration (ms-2) Time (s) If decelerating, the acceleration will be NEGATIVE.
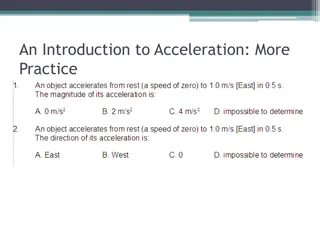
Examples Now, work through these example as a class, completing the solution in your workbook: Example 1: A car starts from rest and reaches a velocity of 8 ms-1 in 4 seconds. What is the acceleration? Example 2: A trolley slows down uniformly from 8 ms-1 to 2 ms-1 in 2 seconds. Calculate the deceleration. Example 3: A vehicle has an acceleration of 3 ms-2. What is its initial velocity if after 6 seconds it is travelling at 50 ms-1. Now, solve the examples from your workbook in your classwork jotter showing full working for each one.
EXPERIMENT i) Set up the apparatus as shown below: Trolley with length of card Light Gates QED Computer 0:00 Ramp Stopwatch ii) Measure the length of the card on the trolley and record in your workbook. iii) Safely release the trolley from the top of the slope and start the stopwatch when it reaches the first light gate. Stop when it reaches the second light gate. Record in your workbook.
EXPERIMENT Trolley with length of card Light Gates QED Computer 0:00 Ramp Stopwatch iv) Record the time taken to pass through each of the light gates from the computer. v) Repeat the experiment 5 further times.
EXPERIMENT vi) Calculate the mean time for each light gate, and for the stopwatch. Length of Card (m) Time from Light Gate 1 (s) Time from Light Gate 2 (s) Time from Stopwatch (s) Mean Time Light Gate 1 = ____________ s Mean Time Light Gate 2 = ____________ s Mean Time Stopwatch = ____________ s
EXPERIMENT vii) Calculate the initial velocity, u: u = length of card tLIGHT GATE 1 viii) Calculate the final velocity, v: v = length of card tLIGHT GATE 2 ix) Calculate the acceleration, a: a = tSTOPWATCH v u
Example Now, work through this example as a class, completing the solution in your workbook: Example: Use the apparatus pictured below along with the following information to calculate the acceleration of the trolley as it travels down the slope. A computer (not shown) measures the time taken for the trolley mask to pass through each light-gate. The trolley mask is 12 cm long. The time taken for the trolley mask to pass through the light-gate near the top of the slope is 0.4 s. The time taken for the trolley mask to pass through the light-gate near the bottom of the slope is 0.1 s. The time for the trolley to travel between the two light gates is 3.0 s.
ACCELERATION Acceleration is defined as the change in velocity per unit time. Final Velocity (m/s) Initial Velocity (m/s) a = v u t Acceleration (ms-2) Time (s) If decelerating, the acceleration will be NEGATIVE.
ACCELERATION EXPERIMENT How to find a : 1) Calculate the initial velocity, u: u = length of card tLIGHT GATE 1 2) Calculate the final velocity, v: v = length of card tLIGHT GATE 2 3) Calculate the acceleration, a: a = tBETWEEN LIGHT GATES v u
Success Criteria: An experiment to measure acceleration will be successfully completed. This knowledge will also lead into future areas of work, such as velocity-time graphs. Tick off the box in your workbook when you have met the success criteria.
Now, use the space in your workbook to produce a summary of acceleration. You may wish to produce concise bullet points, or draw a mind-map, or use any other useful revision technique.