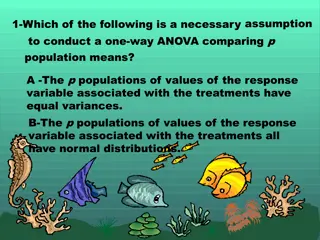
Understanding ANOVA and its Assumptions for Hypothesis Testing
Learn about ANOVA, its application in hypothesis testing, the role of independent and dependent variables, and the importance of assumptions like normality and homogeneity of variance. Explore how to check for these assumptions and make informed statistical decisions using ANOVA.

Download Presentation

Please find below an Image/Link to download the presentation.
The content on the website is provided AS IS for your information and personal use only. It may not be sold, licensed, or shared on other websites without obtaining consent from the author. If you encounter any issues during the download, it is possible that the publisher has removed the file from their server.
You are allowed to download the files provided on this website for personal or commercial use, subject to the condition that they are used lawfully. All files are the property of their respective owners.
The content on the website is provided AS IS for your information and personal use only. It may not be sold, licensed, or shared on other websites without obtaining consent from the author.
E N D
Presentation Transcript
ANOVA Dr. Dyal Bhatnagar
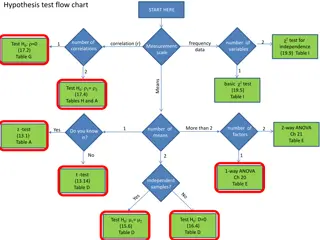
Dependent Variable Metric Non-Metric Discriminant Analysis Binary/Logistic regression Independent Variable(s) Metric Regression Hypothesis testing Non-Metric Chi-square Test
If the independent variable (which is non- metric) has two categories, we will use t-test And if the independent variable has more than two categories we will use F-test (ANOVA)
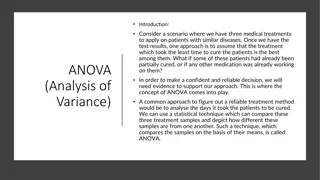
ANOVA ANOVA uses F statistics which is the ratio of variances between groups and variances with-in groups (error variance) If group means do not differ significantly, one can believe that all group means come from same population and do not differ Larger the F statistics Larger is the difference between groups as compared to with-in group differences F Statistics < 1 Indicates no significant difference in the group means and thus Hois correct.
Assumptions Normality: Ho Data are normally distributed Steps to check overall normality Analyze Non parametric tests Legacy dialogs One sample K S test p-value of K S Test > 0.05 Data are normally distributed p-value of K S Test < 0.05 Use Non-parametric test Steps to check category-wise normality Analyze Descriptive Explore Plots Tick Normality plots with stats If your sample size for different categories is comparable, and any one or two categories are not normally distributed, even then, F & t are very robust tests - Andy Field
Assumptions Homogeneity of Variance: We assume that each sample comes from a population with same variance. And thus, variance across samples is homogeneous. Ho Variances across groups is equal or Homogeneous Steps to check overall Variance Analyze Descriptive statistics Descriptives Options Tick Variance Steps to check category-wise Variance Analyze Compare Means Means Options Tick Variance
Levens Test p-value > 0.05 Accept Ho Equal Variances assumed Use ANOVA p-value < 0.05 Reject Ho Equal Variances not assumed Use Welch test
Comparing Means Planned comparisons Exploring the differences in means among all possible pairs of groups, decided a priori by the researcher. Contrasts Unplanned comparisons Post Hoc Tests
Post Hoc Tests Leven s p-value > 0.05 Accept Ho Equal Variances assumed Use ANOVA Post Hoc companion test: Tukey Leven s p-value < 0.05 Reject Ho Equal Variances not assumed Use Welch test Post Hoc Companion test: Games Howell
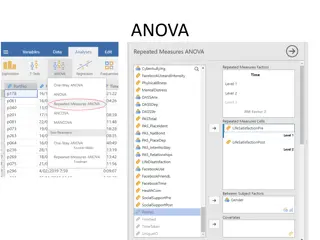
ANOVA: More than one Independent Variable One way ANOVA Analyze Compare Means One Way ANOVA Two way ANOVA Analyse General Linear Model Univariate