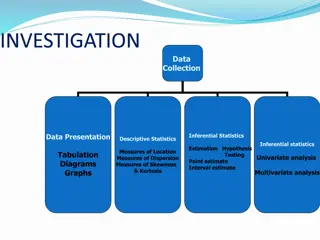
Explore the concept of central tendency in research studies, focusing on mean, median, and mode calculations. Learn how teachers in Applied Linguistics use statistics for their research and understand central tendency.
Please find below an Image/Link to download the presentation.
The content on the website is provided AS IS for your information and personal use only. It may not be sold, licensed, or shared on other websites without obtaining consent from the author. If you encounter any issues during the download, it is possible that the publisher has removed the file from their server.
You are allowed to download the files provided on this website for personal or commercial use, subject to the condition that they are used lawfully. All files are the property of their respective owners.
The content on the website is provided AS IS for your information and personal use only. It may not be sold, licensed, or shared on other websites without obtaining consent from the author.
E N D
Presentation Transcript
DRAL2/ ILA2014 UNDERSTANDING CENTRAL TENDENCY Wannapa Trakulkasemsuk King Mongkut s University of Technology Thonburi
WHY STATISTICS? RESEARCH Qualitative VS Quantitative Mixed-method
MEASUREMENT SCALES no/less quantitative value Nominal scales: e.g. 1 = teacher 2 = engineer 3 = doctor Ordinal scales: e.g. 1 = agree 2 = neutral 3 = disagree Interval scales: e.g. time, numbers of things Ratio scales: e.g. weight, height, distance quantitative value
CENTRAL TENDENCY Mean : interval, ratio scales Median : ordinal, interval, ratio scales Mode : all types of scales
MEAN Data (test scores): 99, 54, 50, 42, 38 Mean = 99 + 54 + 50 + 42+ 38 = 56.6 5 Centre? How would you interpret this mean score (56.6)?
MEDIAN Data (test scores): 99, 54, 50, 42, 38 Median = 99, 54, 50, 42, 38 = 50 Weakness Data 1: 70, 70, 50, 50, 35 Data 2: 52, 51, 50, 49, 48
MODE Data: Rating 1 2 3 4 5 (very disagree) (disagree) (neutral) (agree) (very agree) Frequency 30 14 14 13 30 Mode = 1 and 5 (bi-modal) Mean = 3.02 Median = 3 distribution = skew/not normal mode = better than mean and median
CENTRAL TENDENCY Mean More complex calculation, More powerful (?), More familiar (?) Median less complex calculation, less powerful (?), less familiar (?) Mode what method to use = type of scales, data distribution, purpose, appropriateness
RESEARCH QUESTIONS 1. What do teacher-researchers in Applied Linguistics think about using statistics in their research studies? 2. How do they understand and use central tendency ?
METHOD Subjects: 7 Thai teachers of English at KMUTT with experience in doing research in Applied Linguistics Instrument: (informal) semi-structure interview
FINDING II: KNOWLEDGE AND USE OF CENTRAL TENDENCY KNOWLEDGE: Mean = most familiar method Median/Mode = unfamiliar methods USE: Mean = most frequently used method Median/Mode = never used methods
CONCLUSION As central tendency is commonly used/found in Applied Linguistics research, researchers in the field should be aware of the methods and choose the most appropriate one to interpret data.