Understanding Change of State Graphs and Heating Curves in Physics
Explore the concepts of change of state graphs and heating curves in physics, including the melting, boiling, freezing, and condensation points, as well as the heating curve representation of phase changes and energy transfer. Learn about heat of fusion, heat of vaporization, and the importance of flat portions on the curve.
Uploaded on | 0 Views
Download Presentation

Please find below an Image/Link to download the presentation.
The content on the website is provided AS IS for your information and personal use only. It may not be sold, licensed, or shared on other websites without obtaining consent from the author. If you encounter any issues during the download, it is possible that the publisher has removed the file from their server.
You are allowed to download the files provided on this website for personal or commercial use, subject to the condition that they are used lawfully. All files are the property of their respective owners.
The content on the website is provided AS IS for your information and personal use only. It may not be sold, licensed, or shared on other websites without obtaining consent from the author.
E N D
Presentation Transcript
Change of State Graph or Heating Curves
Learning Objectives I can find the melting, boiling, freezing, and condensation points on a change of state graph. I can determine portions of a change of state graph that represent solid, liquid, and gas.
What are some things that happen as we heat a sample up? Solid Liquid Gas Melting, Evaporating Particles move apart Lose attraction Particles speed up
What are some things that happen as we let a sample cool? Gas Liquid Solid Freezing, Condensation Particle move closer together Gain attraction Particles slow down
What is heat of fusion? What is heat of vaporization? Hfis the amount of energy needed to completely make a solid into a liquid Hvis the amount of energy needed to completely make a liquid into a gas
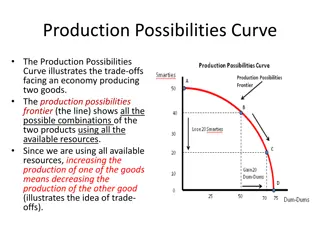
What is the heating curve? The heating curve is a graph which represents how a sample changes phases. As heat is added over time, the sample changes temperature and phase accordingly. Thus heating curve.
What are the parts of the hearting curve Vaporization B.P. 2400C Liquid + Gas Heat of Vaporization Hv Melting M.P. 1000C Solid + Liquid Heat of Fusion Hf
How to remember Endothermic/Exothermic Boiling B.P. 2400C Liquid + Gas Heat of Vaporization Hv Melting M.P. 1000C Solid + Liquid Heat of Fusion Hf
Why is the curve flat at some portions? Temperature is staying constant BC and DE BC the solid becomes a liquid (melting). This is called the heat of fusion (Hf). DE liquid becomes a gas (vaporization). This is called heat of vaporization (Hv). Energy is being used to change the state and not the temperature.
Which requires more energy? Does Heat of Fusion (Hf) BC or Heat of Vaporization (Hv) DE require more energy? Why and explain. Hint: Analyze the graph and think about what is happening to the molecules.
Summary The heating curve is a useful tool to show us the changes in temperature, and energy as a sample is heated up. It give us detailed information about phases and phase changes of samples.
Big Ideas During a change of state, the energy of the substance changes and NOT the TEMPERATURE. Substances change state when they reach their melting, freezing, boiling, and condensation points.


