Understanding Correlation Coefficients in Social Statistics
Learn how to determine the significance of correlation coefficients in social statistics, including assessing strength, measuring significance, and testing classical models for significance. Explore the impact of confidence levels and the classical null hypothesis on relationships between variables.

Download Presentation

Please find below an Image/Link to download the presentation.
The content on the website is provided AS IS for your information and personal use only. It may not be sold, licensed, or shared on other websites without obtaining consent from the author. If you encounter any issues during the download, it is possible that the publisher has removed the file from their server.
You are allowed to download the files provided on this website for personal or commercial use, subject to the condition that they are used lawfully. All files are the property of their respective owners.
The content on the website is provided AS IS for your information and personal use only. It may not be sold, licensed, or shared on other websites without obtaining consent from the author.
E N D
Presentation Transcript
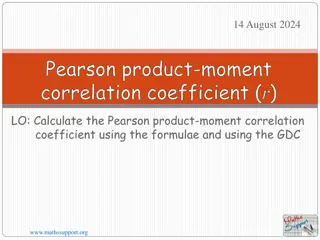
Social Statistics: Correlation coefficient
Whether the correlation is significant Once you know the correlation coefficient for your sample, you might want to determine whether this correlation occurred by chance. Or does the relationship you found in your sample really exist in the population or were your results a fluke? Or in the case of a t-test, did the difference between the two means in your sample occurred by chance and not really exist in your population. 2
Whether the correlation is significant If you set your confidence level at 0.05 Let s assume that you collected your data with 100 different samples from the same population and calculate correlation each time. So, the maximum of 5 out of 100 samples might show a relationship when there really was no relationship (r=0) 3
Correlation Any relationship should be assessed for its significance as well as its strength Pearson correlation measures the strength of a relationship between two continuous variables Correlation coefficient: r Coefficient of determination: r2 Significance is measured by t-test with p=0.05 (which tells how unlikely a given correlation coefficient, r, will occur given no relationship in the population) The smaller the p-level, the more significant the relationship The larger the correlation, the stronger the relationship 4
Classical model for testing significance You have a sample from a population Whether you observed statistic for the sample is likely to be observed given some assumption of the corresponding population parameter. 5
Classical model for testing significance The classical model makes some assumptions about the population parameter: Population parameters are expressed as Greek letters, while corresponding sample statistics are expressed in lower-case Roman letters: r= correlation between two variables in the sample ?(rho) = correlation between the same two variables in the population A common assumption is that there is NO relationship between X and Y in the population: ? = 0.0 Under this common null hypothesis in correlational analysis: r = 0.0 6
Classical model for testing significance When the test is against the null hypothesis: r xy = 0.0 What is the likelihood of drawing a sample with r xy =0.0? The sampling distribution of r is approximately normal (but bounded at -1.0 and +1.0) when N is large and distributes t when N is small. 7
T test for the significance of the correlation coefficient The simplest formula for computing the appropriate t value to test significance of a correlation coefficient employs the t distribution: ? 2 1 ?2 ? = ? The degrees of freedom for entering the t- distribution is N - 2 8
Quality of parent-child relationship Example Quality of Marriage 76 81 78 76 76 78 76 78 98 88 76 66 44 67 65 59 87 77 79 85 68 76 77 98 99 98 87 67 78 43 33 23 34 31 51 56 43 44 45 32 33 28 39 31 38 21 27 43 46 41 41 48 56 55 45 68 54 33 9
T test for the significance of the correlation coefficient Step1: a statement of the null and research hypotheses Null hypothesis: there is no relationship between the quality of the marriage and the quality of the relationship between parents and children Research hypothesis: (two-tailed, nondirectional) there is a relationship between the two variables = : 0 H xy r : 0 H 1 0 xy 10
Correlation coefficient CORREL() and PEARSON() r=0.393 11
T test for the significance of the correlation coefficient Step2: setting the level of risk (or the level of significance or Type I error) associated with the null hypothesis 0.05 or 0.01 What does it mean? on any test of the null hypothesis, there is a 5% (1%) chance you will reject it when the null is true when there is no group difference at all. Why not 0.0001? So rigorous in your rejection of false null hypothesis that you may miss a true one; such stringent Type I error rate allows for little leeway 12
T test for the significance of the correlation coefficient Step 3 and 4: select the appropriate test statistics The relationship between variables, and not the difference between groups, is being examined. Only two variables are being used The appropriate test statistic to use is the t test for the correlation coefficient ? 2 1 ?2=2.22 ? = ? 13
T test for the significance of the correlation coefficient Step5: determination of the value needed for rejection of the null hypothesis using the appropriate table of critical values for the particular statistic. From t table, the critical value=2.052 (two tailed, 0.05, df=27) T=2.22 If obtained value>the critical value reject null hypothesis If obtained value<the critical value accept null hypothesis 15
T test for the significance of the correlation coefficient Step6: compare the obtained value with the critical value T Distribution Critical Values Table (Critical value r table) compute the correlation coefficient (r=0.393) Compute df =n-2 (df=27) obtained value: 0.393 critical value: 0.367 http://www.gifted.uconn.edu/siegle/research/correlation/corrc hrt.htm 16
T test for the significance of the correlation coefficient Step 7 and 8: make decisions What could be your decision? And why, how to interpret? obtained value: 0.393 > critical value: 0.349 (level of significance: 0.05) Coefficient of determination is 0.154, indicating that 15.4% of the variance is accounted for and 84.6% of the variance is not. There is a 5% chance that the two variables are not related at all 17
Causes and associations Two variables are related to each other One causes another having a great marriage cannot ensure that the parent-child relationship will be of a high quality as well; The two variables maybe correlated because they share some traits that might make a person a good husband or wife and also a good parent; It s possible that someone can be a good husband or wife but have a terrible relationship with his/her children. 18
A critique a correlation can be taken as evidence for a possible causal relationship, but cannot indicate what the causal relationship, if any, might be. These examples indicate that the correlation coefficient, as a summary statistic, cannot replace the individual examination of the data. 19
Exercise To investigate the effect of a new hay fever drug on driving skills, a researcher studies 24 individuals with hay fever: 12 who have been taking the drug and 12 who have not. All participants then entered a simulator and were given a driving test which assigned a score to each driver as summarized in the below figure. Explain whether this drug has an effect or not? x y 1 1 1 1 1 1 1 1 1 1 1 1 0 0 0 0 0 0 0 0 0 0 0 0 23 15 16 25 20 17 18 14 12 19 21 22 16 21 16 11 24 21 18 15 19 22 13 24 20