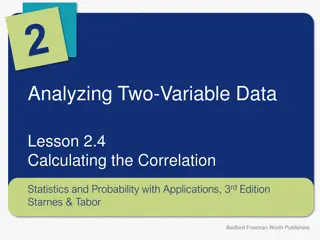
Understanding Correlations: Positive and Negative Relationships Explained
Learn how even Muppets can understand correlations through fun visual examples! Discover the concepts of positive and negative correlations, coefficient of correlation, and the relationship between variables in an engaging way. Explore the impact of friendships on happiness and loneliness, and grasp the mathematical aspect of correlations in research. Join Fozzy Bear as he demystifies correlations in a simple and entertaining manner.

Download Presentation

Please find below an Image/Link to download the presentation.
The content on the website is provided AS IS for your information and personal use only. It may not be sold, licensed, or shared on other websites without obtaining consent from the author. If you encounter any issues during the download, it is possible that the publisher has removed the file from their server.
You are allowed to download the files provided on this website for personal or commercial use, subject to the condition that they are used lawfully. All files are the property of their respective owners.
The content on the website is provided AS IS for your information and personal use only. It may not be sold, licensed, or shared on other websites without obtaining consent from the author.
E N D
Presentation Transcript
Even Muppets can do correlations! AQA Spec 3.2.3 https://m.youtube.com/watch?v=EJ9yAV8uQ7g 1
fozzy on facebook Hello ! I am fozzy bear and we are going to look at facebook today Yay !!! 2
Its all about friends right ? OK so here is my Facebook page and lets all agree about one thing; Facebook is all about friends right ? The more friends you have the happier you will be :o) 3
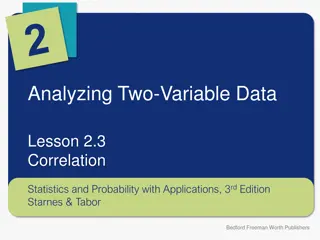
Its all about friends right ? That means there is a positive correlation between friends and happiness. A correlation is a relationship between two variables where changes in one variable go along with changes in the other variable. So back to facebook: the more friends you have the happier you will be :o) 4
There are 2 types of correlations Positive Negative Variable Y Variable Y Variable X Variable X 5
Positive Correlations Number of Friends Positive Correlation: The variables change in the same direction, Like friends and happiness. Happiness 6
Negative Correlations Number of Friends Negative Correlation: The variables change in opposite directions As friends increase, loneliness will decrease. Loneliness 7
The Coefficient of Correlation If you were reporting your research you couldn t just say the line slopes up to the right a bit or it looks positive There is a mathematical value for any correlation. We call this the coefficient of the correlation. This as a mathematical phenomenon https://www.youtube.com/watch?v=8N_tupPBtWQ 8
A coefficient of 0.00 means there is no relationship between the variables. If we compared the number of friends people have to the % mark they got in their year 7 French exam, we might find there was just no connection. Sally got 70% and Billy got 30% but they both have 120 friends This is a zero folks ! 9
The Coefficient of Correlation A value of +1.00 means a perfect, positive correlation. The more hours you work the more money you get. If there is a 100% correspondence between the two, then the correlation would be +1.00 [We all know one whole one is 100% right ?] 10
The Coefficient of Correlation A value of -1.00 means a perfect, negative correlation. The more money you spend the less you have in the bank. There could be a 100% negative correlation between spending and saving. 11
In the real world you dont often find perfect correlations, usually they are weaker. If I say there is a +0.4 correlation between the number of friends people have on Facebook and the number they have in real life. How could that be? 12
In the real world you dont often find perfect correlations, usually they are weaker. If there was a 0.7 correlation between the time spent on facebook and the time spent on homework why is it not -1.0 ? 13
Useful for the exam 3 advantages of correlations: 2 disadvantages They may indicate a connection between 2 issues in situations where experimental proof is impossible. They do not require manipulation of variables and are therefore safer and more ethical than doing experiments on humans. High ecological validity these numbers came from real life They do not prove a causal relationship. 14
Problems with Correlations (1) Correlations show linear relationships but do not reflect curvilinear ones so for example the effect of stress on exam performance : But really it s a curve Correlation shows it as a straight line. Exam Mark Exam Mark Stress Stress 15
Problems with Correlations (2) Correlations demonstrate that there may be a relationship between two sets of data. But they don t show what the cause is !!! You have to try to work out the relationship. Don t fall for the trap of thinking that one aspect automatically causes the other. Suppose I find a correlation between shoe size and the number of facebook friends ? Does that mean that one of them causes the other? I don t think so :o) 16
The third variable problem Does violent crime make people buy more ice-cream? Does eating ice-cream cause violent crime ? Or is there a Third Variable which is causing both ? Oh my ! Oh my ! What could that third variable be? Violent crime Ice cream sales 17
Why not causation? B A Maybe A causes B Or maybe B causes A A B A But something else might cause both. C B A X Or the two things might not be related at all B Y 18
Does facebook improve A Level grades? Maybe increased use of facebook is pushing up grades B A Or maybe better educated students use facebook more A B A But maybe more access to computers has improved A level grades AND led to more people using facebook. C B Or the two things might not be related at all. More online access has boosted facebook A C B D Better teaching pushes up grades. 19
Mini whiteboard Class Activity Draw a simple scatter graph and correlation line on the whiteboard Title Label each axis (including units) Examples that you could use: Like fitness level and number of hours a week spent exercising Or number of calories eaten a day and weight Or temperature and ice cream sales Is your correlation positive or negative ? Now come up with an example of the opposite on the other side of your whiteboard 20
Rules to correlations You have to look at the two variables to see if they are occurring at the same time. The 2 variables have to be measurable Question: On your white boards write down the term for making something measurable or idiot proof ? answer operationalisation.
Activity Can you come up with 3 ideas for a correlation? Write them on your white board now
Studies you know already (or will soon know!) What type of correlation did Bahrick find between the years which had passed and the number of pictures recognised? Belskey found that children who spent too many hours per week in nursery care were more aggressive later what kind of correlation is that ? 23
Your own correlational Study Research question: Is there a relationship between amount of sleep (hours) and score in the end of Biopsychology unit test (%)? Variable 1: Sleep (hours) Variable 2: Biopsychology test score (%) Null Hypothesis: There will be no correlation between sleep and score Write the alternate hypothesis now Would you make it one tailed or two tailed? Why?
Time for some drawing Have a go at plotting your data on a graph of your own Include : A title Label both axis (including units of measurement) Accurately plot the data Draw a line of best fit 25
Teachers Only Here are the answers to the questions. Bahrick negative correlation Belskey positive Petersons - Time, and frequency of remembering trigram Teenagers v old people = correlations don't prove causes Negative correlation more likely between time on facebook and exam marks No independent variable in a correlation if there was it would be an experiment Correlations cannot be more than 1.00 AND they don't prove anything they only demonstrate a link. Correlating age and friends on facebook would fail to allow for the curve just like the example on stress 26


")
")