Understanding Data and MC Analysis Differences
Explore the differences between data and MC analysis through a series of elog notes and images relating to total charge distribution, trigger conditions, and effects of HV changes on events collected in a scientific experiment setting. Gain insights into variations in event rates, trigger conditions, and equipment adjustments impacting event characteristics.

Download Presentation

Please find below an Image/Link to download the presentation.
The content on the website is provided AS IS for your information and personal use only. It may not be sold, licensed, or shared on other websites without obtaining consent from the author. If you encounter any issues during the download, it is possible that the publisher has removed the file from their server.
You are allowed to download the files provided on this website for personal or commercial use, subject to the condition that they are used lawfully. All files are the property of their respective owners.
The content on the website is provided AS IS for your information and personal use only. It may not be sold, licensed, or shared on other websites without obtaining consent from the author.
E N D
Presentation Transcript
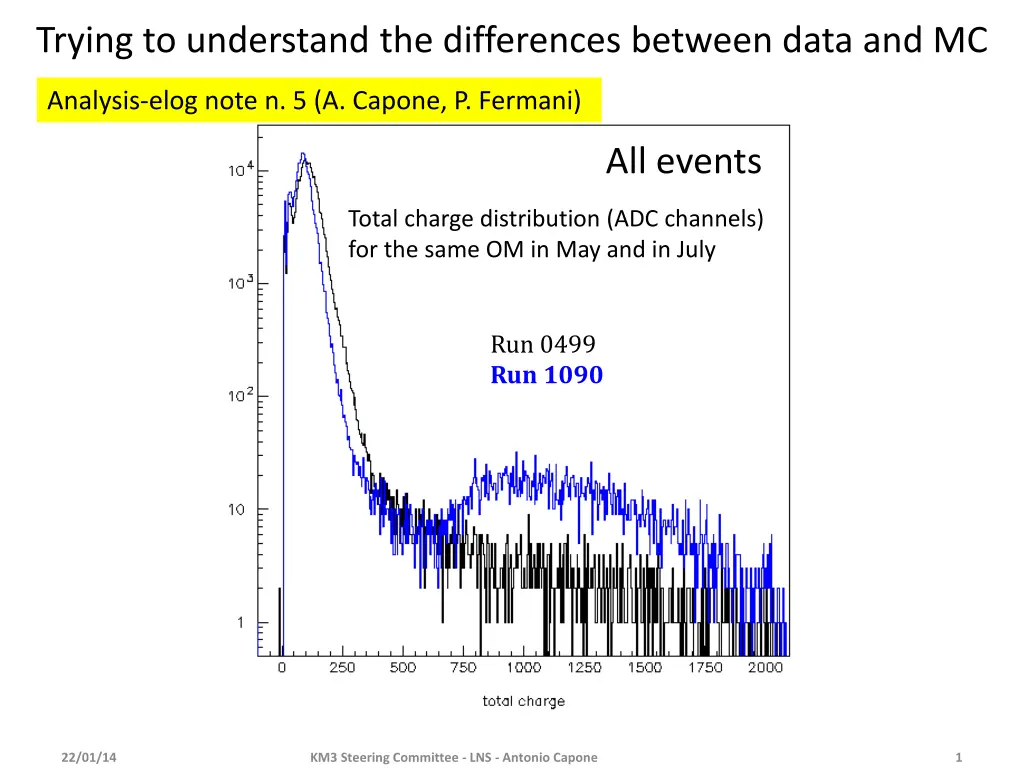
Trying to understand the differences between data and MC Analysis-elog note n. 5 (A. Capone, P. Fermani) All events Total charge distribution (ADC channels) for the same OM in May and in July Run 0499 Run 1090 22/01/14 KM3 Steering Committee - LNS - Antonio Capone 1
On 22 June there is a change ! Run 499 08/05/2013 Run 760 Run 840 Run 845 Run 847 22/06/2013 Run 1011 Run 1050 Run 1090 Run 1409 30/09/2013 Total charge distribution (ADC channels) for OM=1 from May to September 22/01/14 KM3 Steering Committee - LNS - Antonio Capone 2
Since 22/06 Q trigger at L1 is set if has Q>500 Before run 846 the L1Q trigger condition was Q>1000 22/01/14 KM3 Steering Committee - LNS - Antonio Capone 3
Total Charge distribution for events collected with Random trigger (magenta) and for all events (black) G. De Bonis Analyss-elog n. 6 22/01/14 KM3 Steering Committee - LNS - Antonio Capone 4
Info from the NEMO-elog The Q>500 change has increased the L2Q trigger (plg2 SC+Q) that, after the change, has the same rate as the L2 SC+SC, so in the total charge distribution, for "all events" we find the two kind of events with the same rate. T. Chiarusi NEMO-elog 666 22/01/14 KM3 Steering Committee - LNS - Antonio Capone 5
One effect of the H.V. change Analysis-elog note n. 7 (G. De Bonis) Since run 847, not only the trigger change but also the OM HV have been changed: in general decreased. Before this change sometime we saw very long events ("fragmented"). saturation Very long events ! Run 499 Run 1390 ! ! ! Figure,2, ,Waveforms,of,the, long ,hits,from,run,1390,(each,color,denotes,a,different,hit).,Only,linear, scale,is,shown,because,there,are,no, very,long ,hits.,, ! Figure,1, ,Waveforms,of,the, long ,hits,from,run,499,(each,color,denotes,a,different,hit).,Top:,log,scale, for,the,X,axis;,Bottom:,linear,scale,for,the,X,axis., Very,long ,hits,are,present.,, ! ! !! After the HV change no more "saturation" and no more "very long events" 22/01/14 KM3 Steering Committee - LNS - Antonio Capone 6


