Understanding Discrete Probability Distributions for Statistical Analysis
Explore the concept of discrete probability distributions in statistics, focusing on variables with numerical values arising from counting processes. Learn about probability distributions, expected values, variance, and standard deviation of discrete variables through practical examples.

Download Presentation

Please find below an Image/Link to download the presentation.
The content on the website is provided AS IS for your information and personal use only. It may not be sold, licensed, or shared on other websites without obtaining consent from the author. If you encounter any issues during the download, it is possible that the publisher has removed the file from their server.
You are allowed to download the files provided on this website for personal or commercial use, subject to the condition that they are used lawfully. All files are the property of their respective owners.
The content on the website is provided AS IS for your information and personal use only. It may not be sold, licensed, or shared on other websites without obtaining consent from the author.
E N D
Presentation Transcript
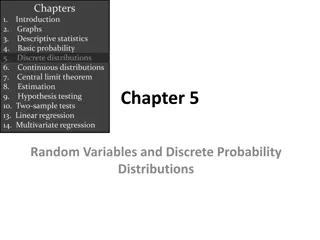
STAT 206: Chapter 5 Discrete Probability Distributions 1
5.1 Probability Distribution for a Discrete Variable Discrete Variable Discrete variables: Have numerical values that arise from a counting process Probability distribution for a discrete random variable: Mutually exclusive list of all the possible numerical outcomes along with the probability of each outcome Types Of Variables Discrete Variable Continuous Variable Ch. 5 Ch. 5 Ch. 5 Ch. 6 Ch. 6 Ch. 6 2
Example: Number of interruptions per day in a large computer network Interruptions in a day 0 1 2 3 4 5 Probability 0.35 0.25 0.20 0.10 0.05 0.05 Counting Process? Yes Mutually Exclusive? Yes Valid Probabilities? Yes Sum to one (1)? Yes 3
Expected value, , of a Discrete Variable Expected value, , of a discrete variable, where xi = ith value of the discrete variable X and P(X=xi) = probability of the occurrence of the ith value of X is: ? = ? ? = ?=? xi?(? = xi) ? Interruptions in a day 0 1 2 3 4 5 Excel Functions: =0*0.35 =1*0.25 =2*0.20 =3*0.10 =4*0.05 =5*0.05 =sum(<string>) General (if A & B): =A2*B2 =A3*B3 =A4*B4 =A5*B5 =A6*B6 =A7*B7 Probability (xi)(P(X=xi)) 0.35 0(0.35) = 0.25 1(0.25) = 0.20 2(0.20) = 0.10 3(0.10) = 0.05 4(0.05) = 0.05 5(0.05) = 1.00 0.00 0.25 0.40 0.30 0.20 0.25 1.40 = ? = ? ? 4
Variance of a Discrete Variable Variance, 2, of a discrete variable, where xi = ith value of the discrete variable X and P(X=xi) = probability of the occurrence of the ith value of X is: 2= ?=? [xi ? ? ]??(? = xi) ? Interruptions in a day 0 1 2 3 4 5 [xi-E(x)]2 [xi-E(x)]2P(X=xi) Probability xi P(X=xi) 0.00(0-1.40) 2 0.25(1-1.40) 2 0.40(2-1.40) 2 0.30(3-1.40) 2 0.20(4-1.40) 2 0.25(5-1.40)2 1.40 0.35 0.25 0.20 0.10 0.05 0.05 1.00 1.96 (1.96)(0.35) 0.16 (0.16)(0.25) 0.36 (0.36)(0.20) 2.56 (2.56)(0.10) 6.76 (6.76)(0.05) 12.96 (12.96)(0.05) 0.686 0.04 0.072 0.256 0.338 0.648 2.04= 2 5
Standard Deviation of a Discrete Variable Standard deviation, , of a discrete variable, where xi = ith value of the discrete variable X and P(X=xi) = probability of the occurrence of the ith value of X is: ? = ?2 Interruptions in a day [xi-E(x)]2 [xi-E(x)]2P(X=xi) Probability xi P(X=xi) 0.00(0-1.40) 2 0 0.35 1.96 (1.96)(0.35) 0.686 0.25(1-1.40) 2 1 0.25 0.16 (0.16)(0.25) 0.04 0.40(2-1.40) 2 2 0.20 0.36 (0.36)(0.20) 0.072 0.30(3-1.40) 2 3 0.10 2.56 (2.56)(0.10) 0.256 0.20(4-1.40) 2 4 0.05 6.76 (6.76)(0.05) 0.338 0.25(5-1.40) 2 5 0.05 12.96 (12.96)(0.05) 0.648 = 1.00 1.40 2.04 1.4283 6
Useful Excel Functions: Add: Summation: Subtract: Multiply: Divide: Raise to a power: Square Root: =<value or reference>+<value or reference> =SUM(<data string>) =<value or reference> <value or reference> =<value or reference>*<value or reference> =<value or reference>/<value or reference> =POWER(<data string>,<exponent>) =SQRT(<value or reference>) Always use Order of Operations (Please Excuse My Dear Aunt Sally): 1. Parentheses 2. Exponents 3. Multiply and/or Divide (left to right) 4. Add and/or Subtract (left to right) 7
PLEASE NOTE: PLEASE NOTE: In the text book and on the homework, the symbol for the probability of a success in a binomial distribution is indicated as ?. I DO NOT LIKE using that symbol so your student notes indicate: Probability of a success in a binomial distribution is ? ??????? = ?, Probability of not success is ? ???_??????? = (? ?) The formulas are the same except for the symbols 8
5.3 Binomial Distribution: Properties A fixed number of observations, n e.g., 15 tosses of a coin; ten light bulbs taken from a warehouse Each observation is categorized as to whether or not the event of interest occurred e.g., head or tail in each toss of a coin; defective or not defective light bulb Since these two categories are mutually exclusive and collectively exhaustive When the probability of the event of interest is represented as p, then the probability of the event of interest not occurring is 1 - p Constant probability for the event of interest occurring (p) for each observation Probability of getting a tail is the same each time we toss the coin 9
Examples of business applications: A manufacturing plant labels items as either defective or acceptable A firm bidding for contracts will either get a contract or not A marketing research firm receives survey responses of yes I will buy or no I will not New job applicants either accept the offer or reject it 10
Counting Techniques for Binomial Suppose the event of interest is obtaining heads on the toss of a fair coin. You are to toss the coin three times. In how many ways can you get two heads? Possible ways: HHT, HTH, THH, so there are three ways you can getting two heads This situation is fairly simple. We need to be able to count the number of ways for more complicated situations COMBINATIONS! The number of combinations of selecting x objects out of n objects is n! Cx n Where: n! =(n)(n - 1)(n - 2) . . . (2)(1) = = x! (n x)! x! = (X)(X - 1)(X - 2) . . . (2)(1) 0! = 1 (by definition) 11
Example: How many possible 3 scoop combinations could you create at an ice cream parlor if you have 31 flavors to select from and no flavor can be used more than once in the 3 scoops? The total choices is n = 31, and we select X = 3 12
Binomial Distribution ?! ?! ? ? !??(1 ?)? ?, where: ? ? = ? ?,? = ? ? = ? ?,? = probability of x events of interest (i.e., x successes ) in n trials, with the probability of a success of p for each trial x = number of events of interest ( successes ) in sample (x = 0, 1, 2, , n) n = sample size (number of trials or observations) p = probability of event of interest ( success ) Example: Flip a coin four times, let x = # heads: n = 4 p = 0.5 1 - p = (1 - 0.5) = 0.5 X = 0, 1, 2, 3, 4 13
EXAMPLES You observe the sex of the next 50 children born at a local hospital; X is the number of girls among them. Binomial
EXAMPLES A couple decides to continue to have children until their first girl is born; X is the total number of children the couple has. Not Binomial
EXAMPLES You want to know what percent of married people believe that mothers of young children should not be employed outside the home. You plan to interview 50 people, and for the sake of convenience you decide to interview both the husband and the wife in 25 married couples. The random variable X is the number among the 50 persons interviewed who think mothers should not be employed. Not Binomial
EXAMPLES The pool of potential jurors for a murder case contains 100 persons chosen at random from the adult residents of a large city. Each person in the pool is asked whether he or she opposes the death penalty; X is the number who say Yes Binomial
EXAMPLES Joe buys a ticket in his state s Pick 3 lottery game every week; X is the number of times in a year that he wins a prize. (Assume 52 weeks in a year) Binomial
Combination Rules Example: A major electronics manufacturer has determined that when one of its DVD player is sold, there is 0.05 chance that the DVD player will need service before the warranty period expires.
EXAMPLE How many different ways to need two repairs? 3 2 3! 3 2 1 2 1 1 = = = 3 ( )( ) 2!(3 2)! How many different ways to need three repairs? 3 3 3! 3 2 1 3 2 1 1 = = = 1 ( )( ) 3!(3 3)!
Example: Suppose the probability of purchasing a defective computer is 0.02. What is the probability of purchasing 2 defective computers in a group of 10? What do we know? Defective / Not defective success = defective 10 computers n = 10 2 defective x = 2 P(defective) = 0.02 p = 0.02 ?! ?! ? ? !??(1 ?)? ? ? ? = 2 10,0.02 = Where did 45 come from? 2! 10 2 != =8!(9)(10) 2 8 ! =90 2= 45 10! 10! 2! 8 ! =(9)(10) 2 ? ? = ? ?,? = 10! 2! 10 2 !0.022(1 0.02)10 2 = (45)(0.0004)(0.8508) =0.01531 21
Example: Blue eyes: According to a Boston Globe story, only about 1 in 6 Americans have blue eyes, whereas a 1900 about half had blue eyes (Source: Data from The Boston Globe, October 17, 2006). For a random sample of 10 living Americans, what is the probability of finding 5 Americans with blue eyes? What do we know? 2 outcomes: blue eyes / not blue eyes n = 10 P(blue eyes) = 1 X = 5 6 ?! ?! ? ? !??(1 ?)? ? 10! 5! 10 5 !(1 ? ? = ? ?,? = 6)5(5 ? ? = 5 10,1 6)5 = 6 =252(1 6)5(5 6)5 = 252 (0.00013)(0.40107) = 0.013024 22
Shape of the Binomial Distribution Controlled by the values of ? and n For example, n = 5 and ? = 0.10 P(X=x|5, 0.1) .6 .4 .2 0 1 x 0 2 3 4 5 Another example, n = 5 and ? = 0.50 P(X=x|5, 0.5) .6 .4 .2 0 0 1 2 3 4 5 x 23
Binomial Distribution Characteristics Mean: ? = ? ? = ?? Variance: ?2= ?? 1 ? Standard deviation: ? = ?? 1 ? Where: n = sample size (# trials) ?=probability of the event of interest (success) for any trial (1- ?)=probability of no success for any trial 24
STAT 201 Textbook examples: Blue eyes: According to a Boston Globe story, only about 1 in 6 Americans have blue eyes, whereas a 1900 about half had blue eyes (Source: Data from The Boston Globe, October 17, 2006) a. For a random sample of 10 living Americans, what is the probability of finding 5 Americans with blue eyes? ? ? = 5 10,1 6 = b. Find the mean and standard deviation of the distribution 5! 10 5 !(1 10! 6)5(5 6)5= 0.013024 ? = ? ? = ??= 10(1 6)=10 6= 1.667 ?? 1 ? = 10(1 5 6= 50 36 ? = = 1.389 = 1.179 6)
Excel Can Be Used To Calculate The Binomial Distribution =BINOM.DIST(<#successes>,<#trials>,<probability_success>,<cumulative?>)
=BINOM.DIST(x x,4,0.30,cumulative cumulative? ?) cumulative? = FALSE cumulative? = TRUE 27
Example: A recent YouGov (UK) survey reported that 27% (0.27) of under-25- year-olds in the United Kingdom own tablets. (Data extracted from Tablets Spur News Consumption, bit.ly/12XpmR0). A random sample of six (6) under-25- year-olds are chosen for a local survey about tablet ownership. Distribution to calculate probabilities? What do we know? Owns tablet/Does not own tablet Fixed sample size/ number of trials (6) Fixed probability of success (0.27) BINOMIAL What is the probability that 4 of the six will own a tablet? ? ? = ? ?,? = 6! 4! 6 4 !0.274(1 0.27)6 4 = 15 0.0053 0.5329 = 0.042481 _OR_ in EXCEL use: =BINOM.DIST(4,6,0.27,FALSE) to get 0.042481 What is the probability that 4 or fewer will own a tablet? Calculate P(X 4)=P(X=0)+P(X=1)+P(X=2)+P(X=3)+P(X=4) _OR_ in EXCEL use: =BINOM.DIST(4,6,0.27,TRUE) to get 0.993328 ?! ?! ? ? !??(1 ?)? ? = ? ? = 4 6,0.27 = 28