Explore how to fill in a table for a given domain in a function using specific values and graphing the function to understand its domain and range easily. Learn the difference between continuous and discrete data representations.
Please find below an Image/Link to download the presentation.
The content on the website is provided AS IS for your information and personal use only. It may not be sold, licensed, or shared on other websites without obtaining consent from the author. If you encounter any issues during the download, it is possible that the publisher has removed the file from their server.
You are allowed to download the files provided on this website for personal or commercial use, subject to the condition that they are used lawfully. All files are the property of their respective owners.
The content on the website is provided AS IS for your information and personal use only. It may not be sold, licensed, or shared on other websites without obtaining consent from the author.
E N D
Presentation Transcript
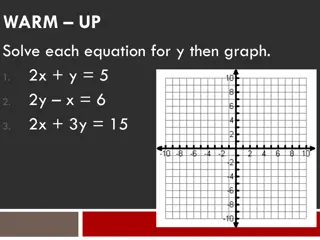
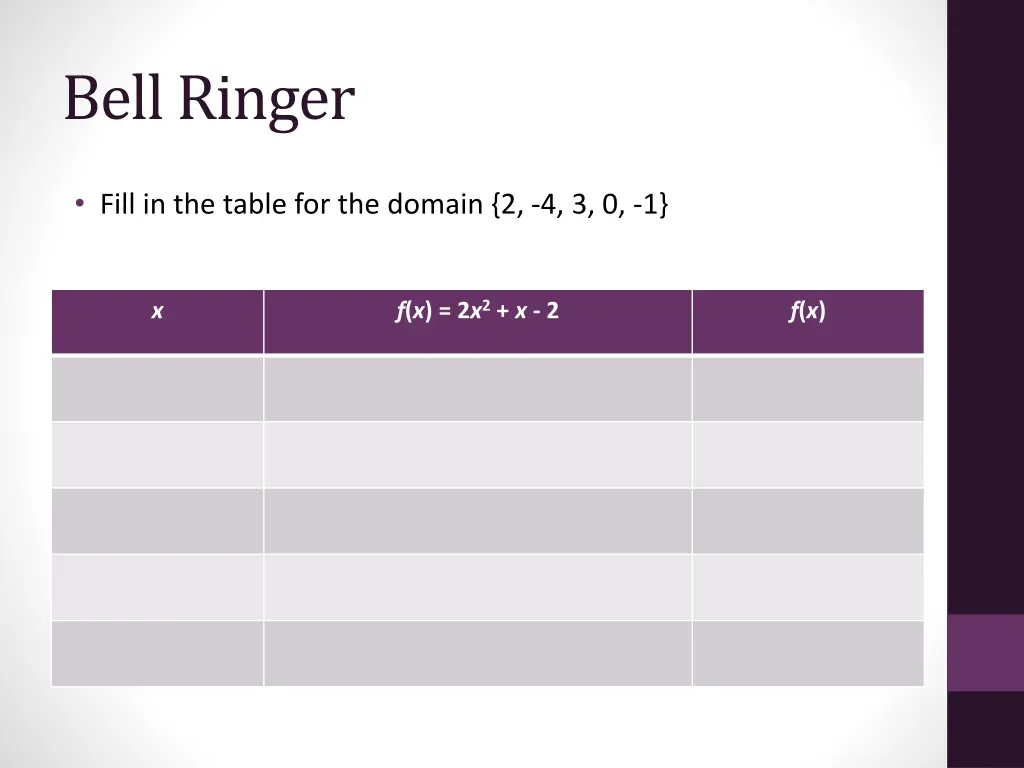
Bell Ringer Fill in the table for the domain {2, -4, 3, 0, -1} f(x) = 2x2+ x - 2 x f(x)
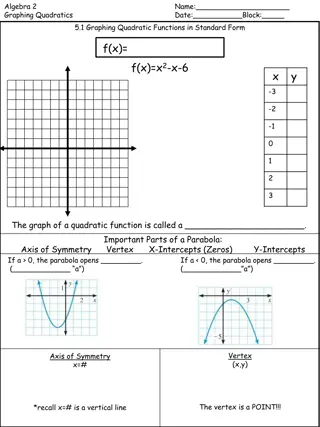
Finding Domain/Range Finding the domain and range is very easy. Find how far left and/or right the x-axis your data goes, and that is your domain. How far it goes up and down the y-axis is your range.
Graphing a Function Fill in your table. The values given are your x coordinates. If you are not given a domain, you can use whatever numbers you want. Plug your domain values into the function. The values you get out are your y coordinates. You should have at least three sets of ordered pairs in order for this to work.
Continuous vs. Discrete Continuous data is data where the numbers between two data points have meaning. A solid line is used to describe continuous data, and it is used to describe things like temperature, weight, age, etc. These examples gradually increase, like temperature. You don t just go from 30 degrees to 100 degrees. There s stuff in between. Discrete data is data that involves a count of items. Marked by points on a graph, and is use to describe the number of things like people, cars, etc. Not continuous, and the values between points have no meaning. You either have one or two people, you cannot have 1.3 people. That s sick.


 = x2 - 2")