Explore the intricate workings of the heart's electrical conduction system, from the SA node to the Purkinje fibers. Learn about ECG waves, segments, and intervals, as well as the significance of cardiac output in maintaining overall health and function. Gain insights into calculating cardiac output and factors affecting stroke volume.
Please find below an Image/Link to download the presentation.
The content on the website is provided AS IS for your information and personal use only. It may not be sold, licensed, or shared on other websites without obtaining consent from the author. If you encounter any issues during the download, it is possible that the publisher has removed the file from their server.
You are allowed to download the files provided on this website for personal or commercial use, subject to the condition that they are used lawfully. All files are the property of their respective owners.
The content on the website is provided AS IS for your information and personal use only. It may not be sold, licensed, or shared on other websites without obtaining consent from the author.
E N D
Presentation Transcript
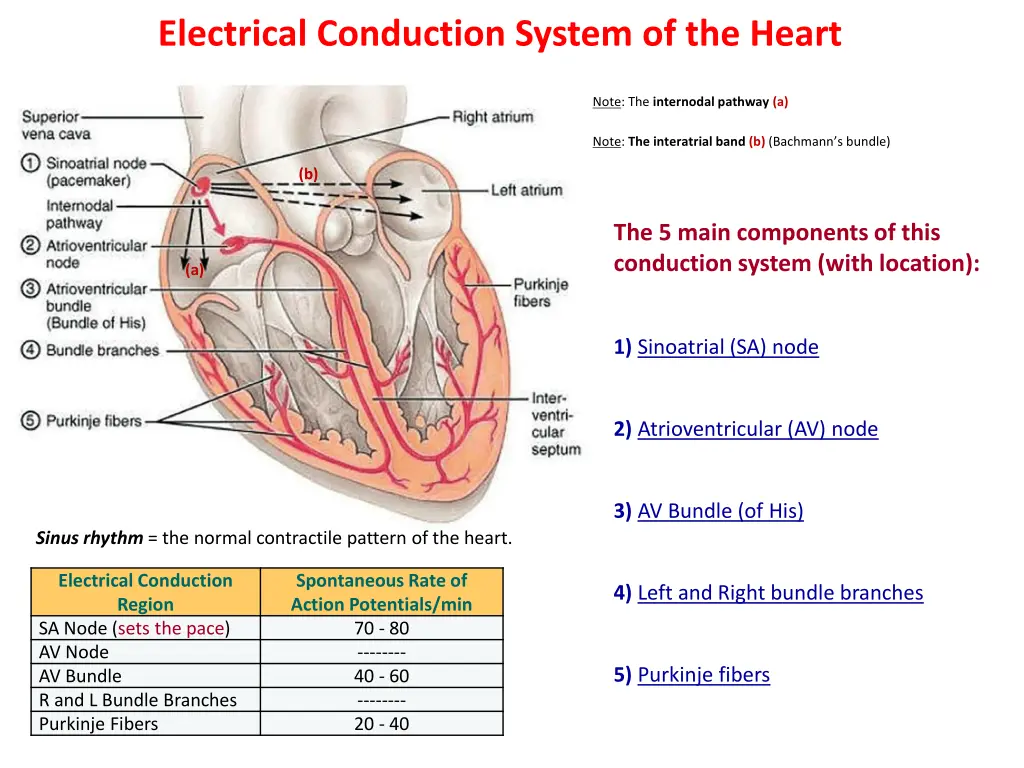
Electrical Conduction System of the Heart Note: The internodal pathway (a) Note: The interatrial band (b) (Bachmann s bundle) (b) The 5 main components of this conduction system (with location): (a) 1) Sinoatrial (SA) node 2) Atrioventricular (AV) node 3) AV Bundle (of His) Sinus rhythm = the normal contractile pattern of the heart. Electrical Conduction Region SA Node (sets the pace) AV Node AV Bundle R and L Bundle Branches Purkinje Fibers Spontaneous Rate of Action Potentials/min 70 - 80 -------- 40 - 60 -------- 20 - 40 4) Left and Right bundle branches 5) Purkinje fibers
ECG Waves P wave: Depolarization of the atria (R and L at same time). *Signal to contract. QRS Complex: Depolarization of ventricles (R and L at same time). Note: atrial repolarization occurs here, usually masked by this large signal on ECG. T wave: Repolarization of the ventricles. *Signal to relax. ECG Segments P-R Interval: Time from onset of P wave to start of QRS complex. Reflects conduction through AV node = time delay between atrial and ventricular activation, called the AV nodal delay . S-T Segment: Portion between the QRS complex and the T wave. Represents early part of repolarization of ventricles. T-P Segment: Flat line, no net electrical events = time of ventricular diastole (filling).
Segment, Wave or Interval Electrical Event Mechanical Event P-Wave Depolarization of the atria. Late ventricular diastole (relaxation). Passive filling of the ventricles (AV valves open). PR Interval Reflects delayed conduction through AV node, or the AV nodal delay . Atrial systole (contraction), top off of ventricular volume (AV valves still open). QRS Complex Depolarization of ventricles Early ventricular systole (contraction). Closure of AV Valves (1st heart sound). Increased ventricular pressure ST Segment No net electrical events. Late ventricular systole. Opening of semilunar valves. Ejection of blood from ventricles into arteries. T-Wave Repolarization of the ventricles. Early ventricular diastole (relaxation). Decreasing pressure, closure of semilunar valves (2nd heart sound). TP Segment No net electrical events. Ventricles continue to relax as pressure falls even lower, AV valves open.
Cardiac Output Cardiac Output (C.O.) = volume of blood ejected by ventricles per unit time. (expressed as minute volume, or liters of blood per minute or L/min) C.O. is set to meet metabolic needs, i.e., is proportional to the tissues need for oxygen (O2) and nutrients, and removal of carbon dioxide (CO2) and waste. C.O. changes with changes in body position. e.g., from recumbent (lying down) to an upright -> HR and SV increase. At rest, healthy adult basal C.O. is about 5 L/min. C.O. can increase 50-100% by anxiety/excitement, and up to 500% by exercise.
Calculating Cardiac Output: CO = HR x SV Factors Affecting Stroke Volume Amount of Ca2+ Preload (EDV) and Afterload (Resistance) ANS (Sym) Physical Activity Emotional State Factors Affecting Heart Rate ANS Hormones Physical Activity Emotional State Heart Rate (beats/min) Stroke Volume (volume/beat) Example Calculations: Below are values for at rest and during exercise. Let s calculate the C.O., including units, showing all work! *SV= EDV-ESV 1) At Rest: HR = 72 EDV = 135 ESV = 65 2) During Exercise: HR = 121 EDV = 178 ESV = 42
Cardiac Output = Heart Rate and Force (Contractility) is Modified by ANS Para activity decreases heart rate and force of contraction. Sym activity increases heart rate and force of contraction. Remember Force is indicated by stroke volume (SV), and SV = EDV - ESV Multiple Factors Influence Stroke Vole (SV), it s homeostatically regulated. SV directly related to the force generated by cardiac muscle during contraction. Greater force of contraction means greater SV, and lesser force means lower SV.
Things that Influence SV: a) Length-Tension or Stretch-Force Relationships As cardiac muscle sarcomere length increases, tension generated contracting muscle increases = SV. More force, greater amount of blood ejected. b)Venous Return or Cardiovascular Preload Blood returning to the heart is termed 'venous return . Increased venous return = stretch cardiac muscle, and they contract more forcefully. Venous return determines EDV, and this determines stroke volume (SV)! Several factors affecting venous return: The Skeletal Muscle Pump . The RespiratoryPump . Sympathetic Activity. Preload = another way of expressing EDV. The greater the EDV = Greater preload = Greater SV. Note: Decreased EDV = Decreased preload = Decreased SV. Afterload = the force ventricles must generate to pump blood against resistance in vascular system. Any increased resistance requires a greater afterload to force open the semilunar valves and pump the blood into the arteries. Increased afterload decreases SV; decreased afterload increases SV.
Summary of Impacts on Cardiac Output Parasympathetic activity decreases heart rate and force of contraction. Sympathetic activity increases heart rate and force of contraction. Optimal Length of Sarcomere = Most Force Note: At rest, cardiac sarcomeres are short, thus stretching heart increased volume) makes heart contract with more force, this will increase SV. chambers (with Preload and Afterload effect Stroke Volume!
Components of the ECG General Features of ECG Wave Deflection from baseline (+ or - direction). Segment - A line between waveforms. Interval - A waveform and a segment. Complex - Consists of several waveforms. Take a look at these links https://www.youtube.com/watch?v=RYZ4daFwMa8 http://ekginterpretation.weebly.com/cardiac-cycle.html Specific Intervals and Segments S-T Segment, T-P Segment PR Segment, P-R Interval QT Interval Specific Waves and Complexes P Wave - QRS Complex - T Wave -
Examine the ECG traces below. Use the Normal ECG trace as a guide. Identify the waves and complexes and state what they indicate. Then find the abnormal component on each of these ECG traces a), b) and c) and suggest what they might indicate: Normal ECG trace a) b) c)
Diastole The Cardiac Cycle: Mechanical Events of the Heart Systole 1. Late Diastole: Heart at rest all chambers relaxed filling with blood (passive filling ~ 80% full). 2. Atrial Systole: atria contract, adds the last 20% of blood to ventricles (top off ventricles) Occurs after P-wave on EKG End Diastolic Volume (EDV) = Maximum ventricular volume*
3. Ventricular Systole (part 1): Ventricular contraction begins - Pressure (P). Closure of AV valves = 1st heart sound ("lub") Sealed Compartment all valves are closed. Isovolumetric ventricular contraction: => pressure builds as volume stays the same.
4. Ventricular Systole (part 2): Ejection phase: P pushes open semilunar valves, blood forced out into artery leaving ventricle. Pulmonary Semilunar => 25 mmHg (minimum pressure) Aortic Semilunar => 80 mmHg (minimum pressure) End Systolic Volume (ESV) = volume remaining in heart after ejection (~ )*. Stroke Volume = EDV - ESV (ml/beat)
5. Ventricular Diastole: Relaxation of ventricles, artery back flow slams semilunar valves shut = 2nd heart sound ("dup"). Sealed Compartment again all valves are closed. Isovolumetric ventricular relaxation: => pressure as volume stays the same. The AV valves then open, refilling starts back to start of cycle.
The Cardiac Cycle Late Diastole Atrial Systole Vent. Systole (part 1) Vent. Systole (part 2) Vent. Diastole


")


 is")


:")
:")