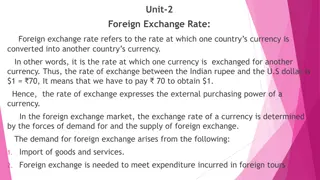
Understanding Foreign Exchange Rate Dynamics in North Korea
Explore the intricacies of North Korea's foreign exchange rate pressures and the role of money control through detailed analysis and visual representations from 2012 to 2023. Delve into factors influencing North Korea's currency value, its trade relations with China, and visible deficits through curated data and insights.

Download Presentation

Please find below an Image/Link to download the presentation.
The content on the website is provided AS IS for your information and personal use only. It may not be sold, licensed, or shared on other websites without obtaining consent from the author. If you encounter any issues during the download, it is possible that the publisher has removed the file from their server.
You are allowed to download the files provided on this website for personal or commercial use, subject to the condition that they are used lawfully. All files are the property of their respective owners.
The content on the website is provided AS IS for your information and personal use only. It may not be sold, licensed, or shared on other websites without obtaining consent from the author.
E N D
Presentation Transcript
North Korea Foreign Exchange Rate Pressures Control by Money? For: US Department of Treasury, Korea Development Institute September 21,2023 William B. Brown NAEIA.Com
Kims Biggest Success North Korea won per US dollar: 2012-2018 10,000 9,000 8,000 7,000 6,000 5,000 4,000 3,000 2,000 1,000 0 1-Sep 27-Sep July 2013 15-Sep 27-Oct Dec-16 Dec-17 Dec-18
Kims Biggest Success North Korea Won Per US Dollar 2012-August 2023 10,000 9,000 8,000 7,000 6,000 5,000 4,000 3,000 2,000 1,000 0 2012 2013 2014 2015 2016 2017 2018 2019 2020 2021 2022 2023
North Korea Won per US Dollar Sep 2020- Aug 2023 10,000 9,000 8,000 7,000 6,000 5,000 4,000 3,000 2,000 1,000 0 Sep Dec Mar June Sep Dec Mar June Sep Dec Mar June Sep Dec Mar June
China-North Korea Trade Jan 2015- August 2023 400 Tough UN Sanctions 350 300 million US dollars 250 200 150 Covid Border Closure 100 50 0 01/2015 01/2016 01/2017 01/2018 01/2019 ChM 01/2020 01/2021 01/2022 ChX
China Trade Surplus with North Korea Jan 2015 - July 2023 China Customs (excludes crude oil) 300 250 200 MILLION US DOLLARS 150 100 50 0 Conjectured non-trade net income Jan-18 Jan-19 Jan-15 Jan-16 Jan-17 Jan-20 Jan-21 Jan-22 Jan-23 -50 China Customs
China Visible Trade Surplus with North Korea Jan 2015 - July 2023 China Customs (excludes crude oil) 300 250 200 MILLION US DOLLARS 150 100 50 0 Conjectured non-trade net income Jan-18 Jan-19 Jan-15 Jan-16 Jan-17 Jan-20 Jan-21 Jan-22 Jan-23 -50 China Customs
North Korea Visible Deficit and Won North Korea Visible Deficit and Won- -Dollar XR Sep 2020 Sep 2020- - July 2023 July 2023 Sep 2020 Sep 2020- - July 2023 July 2023 North Korea Visible Deficit and Won North Korea Visible Deficit and Won- -Dollar XR Dollar XR Dollar XR Chinese Visible Trade Surplus Jan 2020-July 2023 Jan 2020-July 2023 Chinese Visible Trade Surplus North Korea Won per US Dollar Sep 2020- Aug 2023 10,000 180.0 180.0 160.0 160.0 9,000 140.0 140.0 120.0 120.0 8,000 100.0 100.0 7,000 80.0 80.0 60.0 60.0 6,000 40.0 40.0 5,000 20.0 20.0 0.0 0.0 Jan-20 Jan-20 Jan-21 Jan-21 Jan-22 Jan-22 Jan-23 Jan-23 July July 4,000 Sep Dec Mar June Sep Dec Mar June Sep Dec Mar June Sep Dec Mar June -20.0 -20.0
China Yuan per US Dollar China Yuan per US Dollar Pyongyang cross Pyongyang cross- -rate; 2021 rate; 2021- -23 23 12.000 11.000 10.000 9.000 Pyongyang Cross rate 8.000 7.000 6.000 Fed Reserve Rate 5.000 4.000 May June Jul Aug Sep Oct Nov Dec Jan Feb Mar Apr May June Jul Aug Sep Oct Nov Dec 2023 Feb Mar Apr May June July Aug Series4