Understanding Generational Connections and Sustainable Consumption in Aging Populations
Explore the intersection of generational connections, population aging, and sustainable consumption in the context of National Transfer Accounts (NTA). Learn how NTA measures economic resources across different age groups to support individual needs and societal well-being.
Download Presentation

Please find below an Image/Link to download the presentation.
The content on the website is provided AS IS for your information and personal use only. It may not be sold, licensed, or shared on other websites without obtaining consent from the author. If you encounter any issues during the download, it is possible that the publisher has removed the file from their server.
You are allowed to download the files provided on this website for personal or commercial use, subject to the condition that they are used lawfully. All files are the property of their respective owners.
The content on the website is provided AS IS for your information and personal use only. It may not be sold, licensed, or shared on other websites without obtaining consent from the author.
E N D
Presentation Transcript
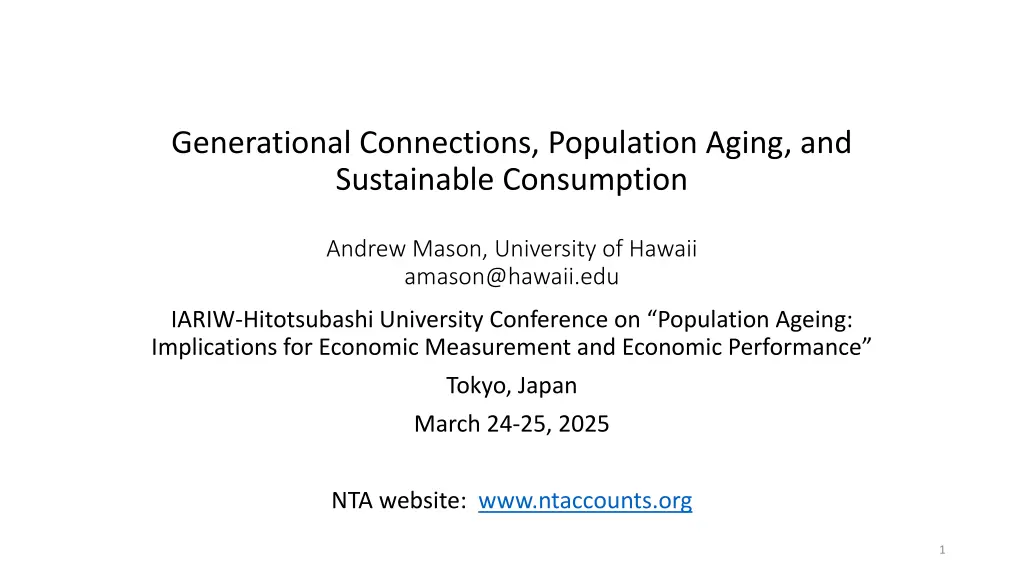
Generational Connections, Population Aging, and Sustainable Consumption Andrew Mason, University of Hawaii amason@hawaii.edu IARIW-Hitotsubashi University Conference on Population Ageing: Implications for Economic Measurement and Economic Performance Tokyo, Japan March 24-25, 2025 NTA website: www.ntaccounts.org 1
Appreciation Co-authors Naohiro Ogawa (Asian Development Bank Institute and University of Malaya) Rikiya Matsukura (Nihon University) Ron Lee (University of California, Berkeley) Gretchen Donehower (University of California, Berkeley) Contributors to the construction of new NTA for Japan (Setsuya Fukuda, IPPS) Organizers of IARIW2025 Satorou Hagino of Reitaku University Chihiro Shimizu of Hitotsubashi University (IARIW member) organizer of the IARIW2025 conference Charles Yuji Horioka of Kobe University (IARIW President-elect) co-organizer 2
Presentation I. II. Population Aging and Sustainable Consumption Introduction to National Transfer Accounts 3
Overview of National Transfer Accounts (NTA) Purpose is to measure how people at every age acquire and use economic resources to support their own needs, to help others, and to prepare for the future Development of NTA has relied heavily on support from many governments, foundations, and international organizations Accounts are estimated by national teams who are familiar with the data and issues that are most relevant to their country 4
More Information Lee and Mason (2013) Population Aging and the Generational Economy: A Global Perspective. United Nations (2013) National Transfer Accounts manual: Measuring and analysing the generational economy. NTA website (www.ntaccounts.org) 6
The lifecycle is fundamental The lifecycle is fundamental NTA provides economic information over the lifecycle with detailed data on: Consumption Asset and labor income Transfers Saving 7
National Transfer Accounts (NTA) Provides estimates of economic flows at all ages, typically single- years-of-age from 0 to 90+ Constructed to maintain consistency with National Accounts Comprised of two accounts The Lifecycle Account quantifies consumption and production over the lifecycle. The Reallocation Account quantifies how resources are reallocations across generations to meet lifecycle needs. NTA flow identity Consumption(x) Labor income(x) = Transfers(x) + Asset income(x) Saving(x) 8
The Lifecycle Account Per capita values for high income countries 9
Notes Based on per capita values for the most recent year for which NTA estimates are available. Twenty-two high income countries. To facilitate comparisons across countries all values are expressed relative to the mean labor income of persons 30-49. Values are simple averages for countries classified as high-income by the World Bank. Source: NTA database www.ntaccounts.org. 10
Reallocation Account Mechanisms used to fund the gap between consumption and labor income Only two mechanisms Transfers: Public and private transfer inflows less outflows Asset-based reallocations: Private and public asset income plus dissaving (or less saving) 11
Aggregate Reallocations, Japan, 2004 6000 4000 2000 Yen (billions) 0 0 10 20 30 40 50 60 70 80 90+ -2000 -4000 -6000 Public Transfers Private Transfers Asset-based Reallocations Source: Ogawa and Matsukura. 12
How will population shocks influence the life cycle and reallocation systems? 14
Are our reallocations sufficient to maintain current consumption? 15
Generational Connections, Population Aging, and Sustainable Consumption Andrew Mason (University of Hawaii at Manoa) Naohiro Ogawa (Asian Development Bank) Rikiya Matsukura (Nihon University) Ron Lee (University of California, Berkeley) Gretchen Donehower (University of California, Berkeley) March 6, 2025 With thanks to Setsuya Fukuda, Sang-Hyop Lee, and Donghyun Park. 16
Findings Given current conditions achieving sustainable consumption requires a shift in consumption by: -23% in Japan -8% in the United States Given demographic changes projected for 2065, shift in consumption will be: -29% in Japan -12% in the United States 17
Why will this happen? Population aging Increase in the gap between consumption and labor income. Many factors that will constrain reallocation systems. 18
Methods Population is exogenous Stable Fertility and mortality based on UN estimates and projections No immigration Generations are self-sufficient in meeting lifecycle needs Lifecycle needs met through age reallocations, relying on transfers and assets. Reallocations shares are held constant but vary between children and seniors. People do not rely on bequests, natural resources, or the rest of the world. Shape of age profiles of consumption and labor income are fixed Sustainable consumption is reached by varying level of consumption relative to labor income 19
Methods Sustainable lifecycle wealth profile Total wealth of a representative cohort from birth to death Wealth is comprised of assets and transfer wealth, the present value of net public and private transfers. Follows a characteristic age pattern. 20
Figure 1. The Lifecycle of Sustainable Wealth Illustrated Wealth from birth to death of a representative cohort (percent of core labor income) No wealth at birth No wealth at death 21
Figure 1. The Lifecycle of Sustainable Wealth Illustrated Wealth from birth to death of a representative cohort (percent of core labor income) Childhood phase: Transfer debt grows 22
Figure 1. The Lifecycle of Sustainable Wealth Illustrated Wealth from birth to death of a representative cohort (percent of core labor income) Childrearing phase: Transfer debt declines as transfers to future generations are paid 23
Figure 1. The Lifecycle of Sustainable Wealth Illustrated Wealth from birth to death of a representative cohort (percent of core labor income) Pre-retirement phase: Wealth needed for retirement is accumulated 24
Figure 1. The Lifecycle of Sustainable Wealth Illustrated Wealth from birth to death of a representative cohort (percent of core labor income) Retirement phase: Wealth declines as retirement is funded. 25
Methods Sustainable consumption is the level of consumption (relative to labor income) that yields the sustainable wealth profile. Six factors influence sustainable consumption Fertility Life expectancy Reallocation shares Lifecycle profiles of consumption and labor income Rates of return to assets Productivity growth Details are available in the paper. 26
Sustainable Consumption 2019, Japan and US For Japan, sustainability is reached with a 23% decline from current levels. For the US, sustainability is reached with a 8% decline from current levels. Population projections to 2065 imply further declines: Additional decline by 6% in Japan and 4% for the US 27
Impact of demographics on sustainable consumption 28
Demographics: Japan and the US Total Fertility Rate Life Expectancy at Birth Pop Growth Rate* 2.5 86 0.2 0 84 n 2 -0.2 82 -0.4 80 1.5 -0.6 78 -0.8 1 76 -1 74 -1.2 0.5 -1.4 72 -1.6 0 70 TFR e0 -1.8 Japan 1984 US 1990 Japan 1984 US 1990 Japan 1984 US 1990 Japan 2019 Us 2019 Japan 2019 Us 2019 Japan 2019 Us 2019 *Steady state growth rate 29
Figure 6. Impact of the total fertility rate on the ratio of sustainable to per capita consumption for 1984, 2019, and 2065 in Japan and for 1990, 2019, and 2065 in the United States. 30
Impact of increase in life expectancy at birth (years) on sustainable consumption (%) Japan United States 8 Increase in life expectancy of 6 years in Japan between 1984 and 2019 led to a 10 percentage point decline in sustainable consumption. 6 4 2 0 -2 Increase in life expectancy of 2.5 years in the US between 1990 and 2019 led to a 1 percentage point decline in sustainable consumption -4 -6 -8 -10 -12 Change in e0 Change in Sust C 31
Impact of old-age support system on sustainable consumption 32
Reallocations: Japan and the US Share of old-age deficit funded by transfers and asset-based reallocations, Japan and the US, 2019 Japan United States 27.1 28.6 71.5 72.9 Transfers Asset-based reallocations Transfers Asset-based reallocations 33
Impact of changes in age profiles of consumption and labor income on sustainable consumption. 35
Figure 3. Normalized per capita consumption and labor income by age, Japan, 1984 and 2019 and the US, 1990 and 2019. Japan US 36
Impact on sustainable consumption (%) of changes in lifecycle profiles of consumption and labor income. 1.2 Japan United States 1 Change in consumption and labor income profiles led to a five percentage point decline in sustainable consumption in Japan and a six percentage point decline in sustainable consumption in the United States. 0.8 0.6 0.4 0.2 0 Baseline Old NTA 37
Conclusions Japan and the United States were both consuming at sustainable levels or close to sustainable levels in the not-so-distant past Current consumption is no longer sustainable due to a mix of factors Lower fertility Higher life expectancy High consumption at older ages High dependence on old-age transfers Low returns on assets Conditions are particularly unfavorable in Japan. 38
How should Japan and the US respond? Support childbearing Empower older workers Improve management of health and long-term care Reform old-age support systems Rethink macroeconomic policy in-light of the impact of low interest rates on reallocations 39


