Understanding Geographic Information System (GIS) and Spatial Data Analysis
Explore the fundamentals of Geographic Information System (GIS) and spatial data analysis, including raster and vector data, software tools, and coding. Learn how GIS connects data to maps, enabling detailed analysis across various industries.

Download Presentation

Please find below an Image/Link to download the presentation.
The content on the website is provided AS IS for your information and personal use only. It may not be sold, licensed, or shared on other websites without obtaining consent from the author. If you encounter any issues during the download, it is possible that the publisher has removed the file from their server.
You are allowed to download the files provided on this website for personal or commercial use, subject to the condition that they are used lawfully. All files are the property of their respective owners.
The content on the website is provided AS IS for your information and personal use only. It may not be sold, licensed, or shared on other websites without obtaining consent from the author.
E N D
Presentation Transcript
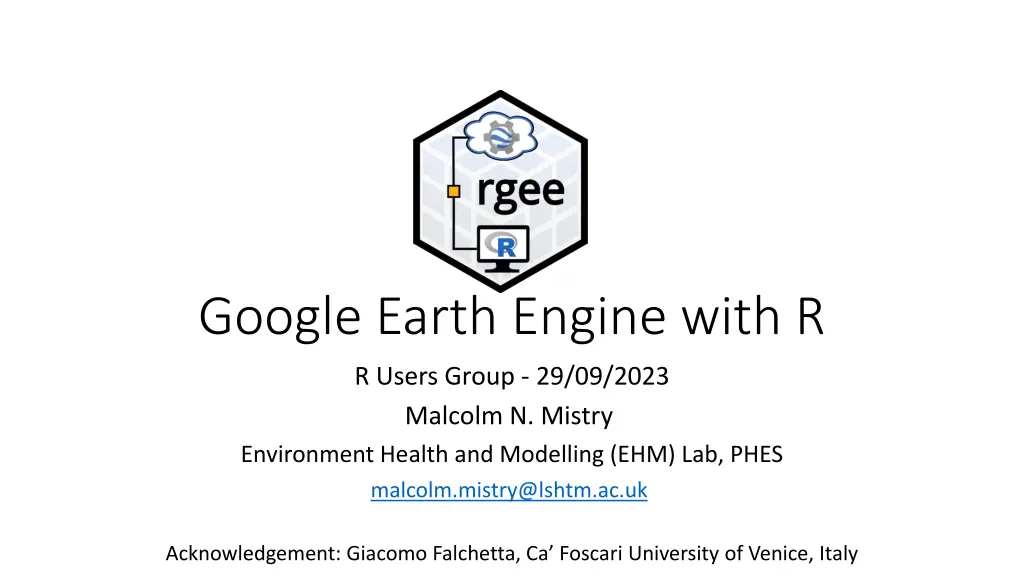
Google Earth Engine with R R Users Group - 29/09/2023 Malcolm N. Mistry Environment Health and Modelling (EHM) Lab, PHES malcolm.mistry@lshtm.ac.uk Acknowledgement: Giacomo Falchetta, Ca Foscari University of Venice, Italy
Outline Geographic Information System (GIS) o Spatial Data o Raster/Vector Google Earth Engine (GEE) o Cloud Computing o Available Data o Lexicon RGEE o Installation o Demo
Introduction: Geographic Information System (GIS) GIS is a system that creates, manages, analyzes, and maps all types of data. GIS connects data to a map, integrating location data (where things are) with all types of descriptive information (what things are like there). This provides a foundation for mapping and analysis that is used in science and almost every industry. Source: https://www.esri.com/en-us/what-is-gis/overview
Introduction: GIS and spatial data Plain data GIS data var_1 var_n var_1 var_n geo obs_1 v1_1 v1_n obs_1 v1_1 v1_n GEO_1 obs_n vn_1 v2_2 obs_n vn_1 v2_2 GEO_n In general, spatial data can be represented as a conventional dataframe with an additional column containing the geographical information relative to each observation.
Introduction: raster and vector Each feature (point, line, polygon) is linked to one measurement for one or more variables attached to it. Each pixel (grid cell) is an independent entity with one or more variables attached to it. (layers) (columns) E.g., the altitude or the temperature at each grid cell. E.g., rivers shapefile contains a variable with the river name.
But some types of info is more suitably stored as either one or the other Raster Continuous units in space, e.g. : Population density Temperature Elevation Wind speed Vector Discrete units in space, e.g. : Rivers Administrative boundaries Lakes Roads Power stations
GIS: software and coding Basically endless, but can be divided in 3 broad groups: Not easily reproducible or combined with other code 1. GUI software with programming capability: ArcGIS (paid), QGIS (open source) Use local computer resources -> can be slow 2. Programming languages' GIS libraries: R, Python, Matlab, Objective of this seminar: show how to combine 2 and 3 3. Online cloud-computing interfaces: Google Earth Engine, Microsoft Planetary Computing
Google Earth Engine FREE cloud-computing for GIS data! Incomparable in speed when working with BIG DATA (e.g., large, high-resolution satellite raster data) More popular in environmental science community Entry barrier (learning it) may look substantial when coming from GUI e.g., ArcGIS Currently, Google offers support only for JavaScript (in browser) and a Python API. https://code.earthengine.google.com However (coming up -> RGEE )
Data availability Data catalogue https://developers.google.com/earth-engine/datasets
Google Earth Engine: lexicon Images: gridded rasters containing pixels with values. Bands: a raster can have multiple variables, e.g. tmax, tmin. ImageCollections: stack of images, for different days/years Features: a geometry, such as a polygon, line, or point, and its associated property fields. For example, a lake feature has a polygon and possibly an associated name and water quality value. FeatureCollections: a collection of features, e.g. a vector containing many points with the same property fields, but with different position in space and property values
Google Earth Engine: lexicon Reducer -> function to collapse e.g. image pixels into a polygons by a given function (e.g. mean/sum/sd) of pixels of raster inside given boundaries.
Google Earth Engine: scale scale Unlike other GIS tools, in GEE the scale (i.e. resolution) of analysis is determined from the output (i.e. from the user request), rather than the input. When we run a function e.g. a reducer or Image download, we need to specify a scale (always in meters) at which to process/download the data GEE does automatically nearest neighbour resampling of the native data resolution to respond to our scale request Bottom line: higer scale (= resolution) increases accuracy of the results (up to the native resolution of the data) but slower processing
rgee rgee: Google Earth Engine for R : Google Earth Engine for R Exploit the cloud computing capability of GEE directly from R scripts Use the petabyte-scale database of GEE without downloading any raw data on your local computer Combine gee functions with your usual functions in R, e.g. from tidyverse or the raster/sf packages fast, efficient, replicable GIS processing from your laptop C Aybar, Q Wu, L Bautista, R Yali and A Barja (2020) rgee: An R package for interacting with Google Earth Engine Journal of Open Source Software URL https://github.com/r-spatial/rgee/.
Setting up and using (r)GEE The installation and other useful scripts will be shared with these slides on R Users Group webpage. Detailed steps available here https://github.com/r-spatial/rgee
Requirements R version 4+ https://cran.r-project.org/bin/windows/base/ RStudio https://www.rstudio.com/products/rstudio/download/ Google account (also institution GMAIL account is fine)
Install rgee (script_configure.R) install from CRAN with: install.packages(c("rgee , geojsonio , tidyverse , mapview , googledrive )) library(rgee) Set up the environment and follow the wizard with: rgee::ee_install() Answer 'Y' and 1 when prompted Check that everything went right with: ee_check()
Install rgee (script_configure.R) Install gcloud (now required for authentication) https://cloud.google.com/sdk/docs/install
Install rgee (script_configure.R) Install gcloud (now required for authentication) https://cloud.google.com/sdk/docs/install
Install rgee (script_configure.R) Finally, in Rstudio load rgee package again andlogin: library(rgee) ee_Initialize(user= malcolm@gmail.com", drive = TRUE, gcs = FALSE) [NB: this is required at the beginning of every new R session, after loading the rgee package. Use the same gmail user id that was used to setup the gcloud]
Basic functionality All rgee functions have the prefix ee_. Auto-completion is your friend Full access to the Earth Engine API with the prefix ee$... rgee is "pipe-friendly %>% You can download GEE data (ee$Image / ee$FeatureCollection) and convert them to raster/sf objects in your local R session: ee_as_sf() -> GEE FeatureCollection to sf Shapefile ee_as_raster() -> GEE Image to Raster
Documentation and learning rgee Github page: https://github.com/r-spatial/rgee rgee beginner manual: http://amazeone.com.br/barebra/pandora/rgeebookT1eng.pdf rgee code examples catalogue: https://csaybar.github.io/rgee- examples/ and https://github.com/csaybar/rgee-examples GEE Stack Overflow: https://gis.stackexchange.com/questions/tagged/google-earth-engine
When in doubt, ask you friend neighbourhood Climate/Geo-Spatial Data Geek malcolm.mistry@lshtm.ac.uk


")


")


GEE")

")
")
")
")