Understanding Global Development and Economic Disparities
Explore the dynamics of global development over time, economic issues, and disparities through engaging activities and insightful Gapminder data analysis. Dive into examining living standards, income distribution, and the impact of economic growth on populations around the world.

Download Presentation

Please find below an Image/Link to download the presentation.
The content on the website is provided AS IS for your information and personal use only. It may not be sold, licensed, or shared on other websites without obtaining consent from the author. If you encounter any issues during the download, it is possible that the publisher has removed the file from their server.
You are allowed to download the files provided on this website for personal or commercial use, subject to the condition that they are used lawfully. All files are the property of their respective owners.
The content on the website is provided AS IS for your information and personal use only. It may not be sold, licensed, or shared on other websites without obtaining consent from the author.
E N D
Presentation Transcript
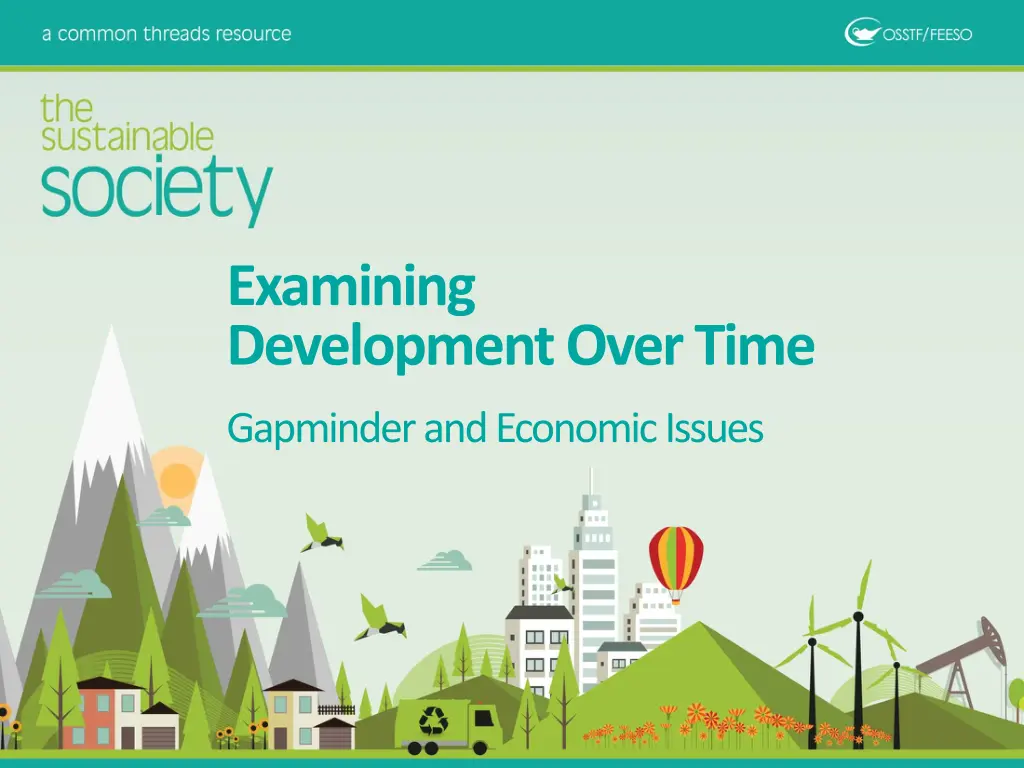
Examining Development Over Time Gapminder and Economic Issues
Game time!!! Find a group of three four Get a set of cards. Organize the cards according to development (i.e., least developed to most developed country). Prepare to explain your choices to the class.
How much does the world make? Population living on less than $10 a day Map of the world Population living on more than $200 a day
Game time part 2!!! What were the measures the class used to evaluate development? What other measures can we consider? Get a copy of the Gapminder World Map graph. On the graph each bubble is a country. The size of the bubble relates to the population of the country and the colour to the region of the world. The y-axis is life expectancy and the x-axis is income per person. Find the countries you ranked on the graph. How does it compare to the placement your group decided on? Were there any surprising results? Could this graph be used to divide the countries of the world into different categories? Why or why not?
Gapminder This graph shows how long people live and how much money they earn. Let s see how countries have developed since 1800 http://www.gapminder.org/world/#;example=75; What does the graph show? As you watch take note of any five things that interest you or that you noticed about the animation.
What this graph shows: In 1800, income per person was low and life expectancy was very short in all countries. Health is better everywhere today, even in the poorest countries. Income is much higher in most, but not all, countries today. The income and health gaps between countries are larger today. Most people today live in middle income countries
Worlds population arranged by income. Each horizontal band represents and equal fifth of the world s people The richest fifth receives 82.7% of total world income and the poorest received 1.4% of the world s income. Source: UNDP, Human Development Report 1992 (New York: Oxford University Press, 1992.
While this is one interpretation of the lifestyle in the varying divisions of wealth, do you feel it is accurate? Where do you see yourself? Source: UNDP, Human Development Report 1992 (New York: Oxford University Press, 1992.
Another cool set of diagrams Let s look at how the world shares its money www.gapminder.org/downloads/human-development-trends-2005/
Your task: In the same groups brainstorm at least 10 reasons as to why the developing world has not achieved economic parity with the developed world. In other words, why are we affluent and they are not? How does income disparity influence the ability of the globe to be sustainable?
Reasons for economic disparity in the world Undemocratic local government Poor infrastructure Lack of health care War Racism Oppression Disease/epidemics Sexual status/sexual orientation rights Greed Population Hunger Education Debt/deficit Multinationals/transnational Trade sanctions Environmental reasons Traditional values (class divisions) Overshot carrying capacity Lack of exports Cash crops Civil strife Ignorance Poor trade policies Egocentrism Historical reasons Other?
More Gapminder world Select Norway, Venezuela and Canada and watch their progress over time. Considering what you have learned about each country note any specific changes and patterns over time? (Think points of historical challenge or opportunity)
Final thoughts Through the PowerPoint you were introduced to different graphics that attempted to demonstrate how the regions of the world have changed since the 1800s. How is modelling relevant when analyzing the development of a nation? How could these tools be used to develop the world towards sustainability? Think people, profit and planet.