Understanding Glucose Homeostasis and Metabolism Insights
Delve into the intricacies of glucose homeostasis and metabolism, exploring the maintenance of blood glucose levels, factors regulating glucose balance, and the vital role of tissues and hormones in this process. Discover the significance of maintaining a stable blood glucose level and the various mechanisms involved in glucose regulation.

Download Presentation

Please find below an Image/Link to download the presentation.
The content on the website is provided AS IS for your information and personal use only. It may not be sold, licensed, or shared on other websites without obtaining consent from the author. If you encounter any issues during the download, it is possible that the publisher has removed the file from their server.
You are allowed to download the files provided on this website for personal or commercial use, subject to the condition that they are used lawfully. All files are the property of their respective owners.
The content on the website is provided AS IS for your information and personal use only. It may not be sold, licensed, or shared on other websites without obtaining consent from the author.
E N D
Presentation Transcript
CHO METABOLISM BY Dr. Naglaa Ibrahim Azab Assistant professor of medical biochemistry
BLOOD GLUCOSE HOMEOSTASIS (REGULATION OF BLOOD GLUCOSE LEVEL)
What is glucose homeostasis??? It is the maintenance of blood glucose level within the normal range
Normal blood glucose level (mg/dl) Fasting 70-110(126) (6-12 h after meals) 130-150 1 h after CHO meals 2 h after CHO meals 70-110(126) Starvation (prolonged fasting) 60-70
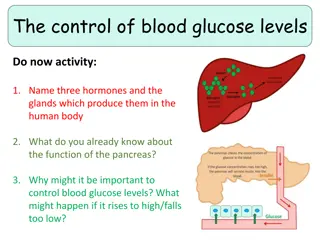
Importance of glucose homeostasis Maintain a continuous supply of sufficient blood glucose to the brain and CNS Sudden hypoglycemia (< 40 mg/dl) lead to???? Coma and even death
Gluconeogenesis (mainly from amino acids) Main source during prolonged starvation (> 18 hrs) Glycogenolysis (Liver glycogen) Diet by digestion and absorption Source during early fasting (12- 18 hrs) mostly Blood glucose Uptake by Tissues as muscles, adipose tissue & brain Oxidation glycogenesis lipogenesis
How to maintain the balance between addition and removal of glucose??? (What are the factors important for maintaining glucose homeostasis What are the factors that regulate blood glucose level???? tissues hormones
Tissues regulating blood glucose level Muscles and adipose tissues GIT Liver Kidney
GIT Maximum rate of glucose absorption is 1 gm glucose/Kg body weight / hour prevents sudden hyperglycemia after meal. Glucose \ / \ enterogastrone hormone from duodenum intestinal factors \ \ stimulate insulin secretion from pancreas - - - gastric evacuation
Liver (Blood glucostat) After CHO diet Fasting Uptake Glycogenolysis Oxidation Glucose Glycogenesis Gluconeogenesis LIPOGENESIS Blood glucose Blood glucose
After CHO diet Muscle &Adipose tissue Fasting Uptake Gluconeogenesis Muscle: Release alanine to liver Adipose tissue:by lipolysis release glycerol and f.as Oxidation Glucose \ Glycogenesis in muscle Lipogenesis In adipose tissue Blood glucose Blood glucose
Kidneys Renal threshold for glucose is 180 mg/dl
Insulin Uptake (except brain, liver,RBCs- non dependant) Glycogenolysis Oxidation \ \ Glucose Glycogenesis Gluconeogenesis \ LIPOGENESIS Lipolysis Blood glucose
Glucagon and adrenaline Uptake Glycogenolysis Oxidation \ Glucose \ Glycogenesis Gluconeogenesis \ LIPOGENESIS Lipolysis Blood glucose
Clucocorticoids and G.H. Uptake \ Glucose Gluconeogenesis \ \ \ Oxidation a.as \ ( glucocorticoids) Lipolysis ( G.H) Blood glucose
Thyroid hormones Uptake Absorption Glycogenolysis Oxidation \ Glucose \ Glycogenesis Gluconeogenesis LIPOGENESIS Blood glucose
Presence of detectable amounts of glucose in urine (> 0.5 g/day, normally < 150 mg/day).
Causes: I. Hyperglycemic glucosuria: Diabetes mellitus glucosuria Adrenaline glucosuria Pheochromocytoma. Emotions. Stress (oral examination). Hypotension Injection 1) 2) - - - - - 3) of large amounts of glucose after prolonged carbohydrate deprivation. Alimentary glucosuria: It is due to intake
Causes: II. Renal glucosuria (plasma glucose < 180 mg/dl): 1) Congenital glucosuria : = renal diabetes = Diabetes innocence = benign glucosuria. 2) Pregnancy glucosuria : Occurs in about 20% of normal pregnancies. 3) Nephritis & Nephrosis : Only some cases show glucosuria. 4) Phlorrhizin Glucosuria : Phlorrhizin inhibits renal tubular reabsorption of glucose.
DIABETES ME LLITUS
DM hyperglycemia \ glucosuria syndrome \ polyuria \ \ polydepsia \ polyphagia Loss of weight
Causes anti-insulin hormones (glucagon, adrenalin ) insulin level or insulin resistance Types Type I: Insulin dependent DM =IDDM = Juvenile diabetes. Type II: Non Insulin dependent DM =NIDDM = Maturity onset DM
Metabolic changes in DM 1-Disturbed Carbohydrates metabolism: hyperglycemia due to - Decreased glucose uptake and utilization by tissues. - Decreased glycogenesis &lipogenesis. - Increased glycogenolysis &gluconeogenesis. 2-Disturbed lipid metabolism: hyperlipidemia and hypercholesterolemia due to - Increased lipolysis and plasma FFA - Increased ketogenesis: which may cause ketoacidosis
Metabolic changes in DM 3-Disturbed protein metabolism: Negative nitrogen balance ,wasting ,weakness of muscle and delayed healing of wounds due to - Decreased protein anabolism. - Increased protein catabolism. 4-Disturbed water and electrolyte balance: - Glucosuria osmotic dieresis polyuria dehydration polydepsia - Increased loss of Na+ & K + in urine.
Points of differences Insulin-dependent diabetes mellitus (IDDM) Non-insulin-dependent diabetes mellitus (NIDDM) Type I; juvenile-onset diabetes Usually during childhood or puberty Type II; adult-onset diabetes Other name Age of onset Frequently after age 35 Nutritional at time of onset of the disease status Frequently undernourished Obesity usually present Prevalence 10-20% of diagnosed diabetics Moderate -cells destroyed, eliminating production of insulin 80-90% of diagnosed diabetics Genetic predisposition Defect or deficiency Very strong Inability of cells to produce appropriate quantities of insulin, insulin resistance Ketosis Plasma insulin Acute complications Oral hypoglycemic drugs Common Low or absent Ketoacidosis Rare Normal or high Hyperglycemia Unresponsive Responsive Treatment insulin with Always necessary Usually not required
Complications of DM 1-Macrovascular complications of DM: (atherosclerosis, hypertension, myocardial infarction and renal failure). Most of these complications are due to damage of the large blood vessels by glycosylation of protein molecules in the wall of blood vessels secondary to hyperglycemia. The presence of hypercholesterolemia and hyperlipoproteinemia increase the risk for the development of atherosclerosis and its complications. 2- Microvascular complications: They affect the small blood capillaries and lead to : Diabetic retinopathy and neuropathy . These are due to vascular damage caused by protein glycation and sorbitol (the alcohol of glucose ) accumulation.
Complications of DM 3- Diabetic cataract : It usually occurs in young age . It is due to accumulation of sorbitol in the eye lens, which leads to osmotic accumulation of fluid in the lens lead to its opacity. 4-Diabetic coma: Coma is loss of consciousness. There are many types of coma.
Differences between hyperglycemic and hypoglycemic coma Points of differences Diabetic Coma Hyperglycemic coma Hypoglycemic Coma Cause Severe uncontrolled DM. Insulin overdose Mouth Odor of acetone Absent Respiration Hyperventilation (acidosis) Normal Pulse Rapid & weak (dehydrated) Rapid & strong (increased sympathetic activity) Sweating Skin Dry (dehydrated) Blood Glucose Hyperglycemia Hypoglycemia Urine Glucose Present Absent Urine Acetone Present Absent
Treatment of coma hyperglycemic coma treated by insulin and glucose intravenous to avoid sever drop of blood glucose correction of electrolyte imbalance resulting from acidosis and polyuria . hypoglycemic coma treated by glucose infusion.
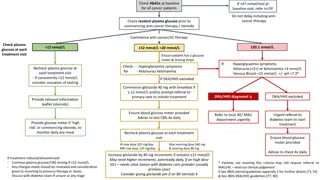
Diagnosis of DM 1- By measuring the blood glucose level in fasting( 8-12 h) state and two-hour postprandial blood glucose level. a) Normally: Fasting blood sugar = 70 110 mg/dl. 2-hours postprandial = up to 140 mg/dl. b) Fasting blood glucose = > 140 mg/dl. 2-hours postprandial = > 200 mg/dl. In Diabetics:
Diagnosis of DM 2- Oral glucose tolerance test (OGTT): - After fasting 8-12 hours, the patient is given 70 gm D- glucose (1 g/Kg body weight) in a cup of water - Blood and urine samples are taken fasting, , 1, 1 , 2, 2 hours. - Samples are analyzed for glucose. - A blood sugar curve is plotted.
Diagnosis of DM Comments on normal & abnormal oral glucose tolerance curves Time 0 time Fasting hour an 1 hour 1 hour 2 hours 2 hours Blood Glucose Normal Minimum curve 80 mg/dl 90 mg/dl 105 mg/dl 105 mg/dl 90 mg/dl 80 mg/dl Normal Maximum curve 120 mg/dl 135 mg/dl 160 mg/dl 140 mg/dl 120 mg/dl 120 mg/dl Curve with mild diabetes115 mg/dl 145 mg/dl 180 mg/dl 160 mg/dl 160 mg/dl 130 mg/dl Curve severe diabetes with 200 mg /dl 235 mg/dl 265 mg/dl 280 mg/dl 290 mg/dl 300 mg/dl
Diagnosis of DM - In normal persons: fasting 70 120 it increases after 1 hour and returns back to fasting after 2 hours: The blood glucose never exceeds 170 mg/dl. No glucosuria. - In Diabetes mellitus: the fasting is more than normal ( > 110 mg/dl or more ) and the curve takes 3 hours or more to return back to fasting level. One or more samples exceed 180 mg/dl. There is glucosuria.
Diagnosis of DM 3-Measurement of glycosylated Hb (HbA1C) Glycosylated Hb (HbA1c) results from non enzymatic binding of glucose with Hemoglobin .The process is irreversible and continues during the half life of RBCs. Normal subjects and controlled cases of DM have 4- 8% glycosylated Hb . The increase in the percent of HbA1c is related to the blood glucose level. The test is used for follow up of diabetic patients. Not affected by fasting or feeding or any factor that affect blood glucose immediately so it gives an idea about the glycemic control of the patient throughout the life span of RBCs ( 120 days ).Also it gives an idea about the efficiency of the drugs used in treatment and adjustment of proper dose.
Other types of DM 1- (ADH). Urine volume > 10 L/day, watery specific gravity 1003. 2- Steroid diabetes: Long term treatment with glucocorticoids which cause hyperglycemia. Prolonged hyperglycemia causes exhaustion of -cell of pancreas. Diabetes insipidus: Deficiency of antiduretic hormone 3- emotional states. Stress diabetes : Due to increased adrenaline in 4- Experimental diabetes; could be caused by : Alloxan Streptozotocin Dehydroascorbic acid Surgically by removal of pancreas
Other types of DM Differences between diabetes mellitus and diabetes insipidus Points of differences Diabetes Insipidus Diabetes Mellitus Cause Decreased ratio of Insulin / Anti-insulin Decreased ADH < 10 L/ day 15 25 L/ day Urine volume >1030 <1030 Urine gravity specific Present Glucose in urine Absent
It is the decrease of blood glucose level to less than 50 mg /dl.
Importance The CNS is very dependent on a continuous supply of blood glucose as a fuel for energy.
Symptoms Adrenergic symptoms mediated by epinephrine release Neuroglycopenic symptoms (neuroglycopenia) Mediated by impaired delivery of glucose to the brain \ \ Palpitation Tremors sweating impairment of brain functions causing headache, confusion ,slurred speech, seizures, coma and even death Anxiety
Causes Overdose of insulin (most common cause) Postprandia l hypoglycemia: Fasting hypoglycemia \ \ Alimentary hypoglycemia due to exaggerated insulin release following a carbohydrates meal or after gastrectomy Liver cell failure (no glycogenolysis or gluconeogenesis) Chronic Alcoholism due to excessive alcohol intake with decreased food intake (no gluconeogenesis) Glycogen storage diseases (Von Gierke's disease) G-6-p can not leave liver (no G-6-phosphatase Hereditary fructose intolerance : Ingestion of sucrose causes hypoglycemia due to accumulation of fructose -1-P which inhibits glycogenolysis by allosteric inhibition of liver phosphorylase enzyme. Adrenocortical insufficiency (Addison's disease). (glucocorticoids)
CH3-CH2OH CH3-CHO CH3-COOH ACTIVE ACETATE - - Phosphofructokinase enzyme Gluconeogenesis Fructose-6-P PFK-2 Phosphofructo- kinase-1 (PFK-1) Fructose-1,6- Bisphosphatase Fructose-2,6-BP Fructose-1,6-BP Glycolysis


")