Understanding Hypothesis Testing in Research
Explore the significance of hypothesis testing in research, distinguish between research and statistical hypotheses, and learn about the steps and tests involved in this crucial process. Understand the importance of formulating and analyzing hypotheses to draw meaningful conclusions from data.

Download Presentation

Please find below an Image/Link to download the presentation.
The content on the website is provided AS IS for your information and personal use only. It may not be sold, licensed, or shared on other websites without obtaining consent from the author. If you encounter any issues during the download, it is possible that the publisher has removed the file from their server.
You are allowed to download the files provided on this website for personal or commercial use, subject to the condition that they are used lawfully. All files are the property of their respective owners.
The content on the website is provided AS IS for your information and personal use only. It may not be sold, licensed, or shared on other websites without obtaining consent from the author.
E N D
Presentation Transcript
The purpose of hypothesis testing is to help (aid, lead) the clinician, the researcher, or the administrator in reaching a decision concerning a population by examining a sample from that population. It involves conducting a test of statistical significance and qualifying the degree to which sampling variability may account for the results observed in a particular study.
Hypotheses; May be defined simply as a statement about one or more populations, it is usually concerned with the parameters of the population about which the statement is made and by means of hypothesis testing one can determine whether or not such statements are compatible with the available data, researchers are concerned with two types of hypotheses 1- Research hypothesis 2- Statistical hypothesis
Research hypothesis; is the supposition (conjecture) that motivates the researcher to do a research, it may be the result of years of observations, clinical experience, or from scientific speculation. Research projects often result from the desire of health practitioners to determine whether or not their theories or suspicions can be supported when subjected to the rigors or scientific investigations. Research hypothesis here form the desire to determine whether or no the suspicions of the researcher, that the mother condition (being diabetic) had effect on birth weight, can be supported when subjected to scientific investigation. So research hypothesis leads directly to the statistical hypothesis (the hypothesis that is going to be tested through certain statistical procedures), later on the statistical hypotheses evaluated by appropriate statistical techniques.
Test of significance; There are many tests of significance developed and utilized. Most common are Z test or normal curve test ,student s t test. Chi-square test , F-test (ANOVA), etc ..
Procedure and steps; The steps involved, in general may be presented as a SEVEN-STEPS procedure, in the utilization of any test of significance are; 1-Data; The nature of the data that form or represent the basis of testing is determined and well understood. The data must be determined whether quantitative or qualitative, and it is presented in mean, SD for quantitative data, and in frequency and proportion for the qualitative data.
2-Assumptions: the assumptions that are of importance in hypothesis testing include; a- Randomly selection of a sample b- Independence of samples c- Normality distribution of the population d- Equality of the variances of the populations And each test of significance has its own proper assumption.
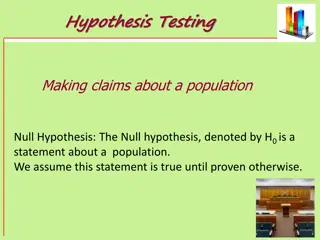
3-Hypothesis: We have two types of statistical hypotheses; a- Null hypothesis b- Alternative hypothesis Null hypothesis (Ho); Or the hypothesis to be tested, symbolized by (Ho) which is defined as the hypothesis of no difference, it is a statement of agreement with (or no difference) conditions presumed to be true in the population of interest. The samples or populations being compared in an experiment, study or test are similar. Any difference occurs is related to chance and not to any other factor. Ho is either not rejected (meaning that the data tested do not provide sufficient evidence to cause rejection) or it is rejected (data are not compatible with, but are supportive to some other hypothesis which is the alternative hypothesis).
Alternative hypothesis (HA); Or it is the hypothesis of difference (so it is the hypothesis adopted when we reject Ho). It is important to remember that when we fail to reject Ho, we do not say that it is true; but that it may be true (the data fail to support our decision or our suspicion). If m1 = m2 this is Ho (No difference) If m1 m2 this is HA (Difference)
In general statistical inference leads to the proof of a hypothesis, it merely indicates whether the hypothesis is supported or is not supported by the available data. When we fail to reject a null hypothesis, therefore we do not say that it is true, but that it is may be true.
4-Level of significance: It specifies the area under the curve of the distribution of test statistics that represent the basis on which determination of the rejection region and acceptance region for the tested data. A tabulated value criticalvalue is going to be obtained from certain tables (each test has its own table to obtain the tabulated value) according to the level of significance ( ) 0.05, 0.025, 0.01 and according to the degree of freedom.
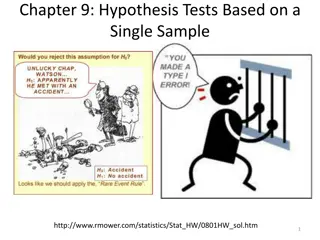
Reject Ho if it is true it is called Type I error, or type of error. Accept Ho if it is false it is called Type II error, or type of error. Type of error: It is the probability of rejecting null hypothesis although it is really true. Type of error: It is the probability of accepting null hypothesis although it is really false.
The probability that we do not make a type II error (100 - %) is called the power of the test, and increasing sample size will increases the power, since the sampling distribution curve would be taller and narrower and therefore overlaps less.
5- Apply the proper test of significance; In which the data derived from the sample is used to compute the difference, the value will make he decision of reject or not reject Ho. The selection of the appropriate test to be utilized and calculation of the test criterion based on the type of data. There are many tests of significance, the most common are Z test, t test, , F-test (ANOVA), From applying the test we are going to determine calculated value or called teststatistic to be compared with the tabulated one obtained at the step of level of significance.
6- Statistical decision; a) P value determination; in which we calculate the magnitude of P value (which is the probability of effect of chance factor) that depend on the level of significancy. In biostatistics and medicine we use to make it as 0.05 or less as the level of significance.
b) Decision of reject or accept Ho; Comparison of the calculated test criterion value with that of the theoretical value at 5%, 1%. - If the calculated test criterion value is higher than the theoretical value of the level of significance point so we fall in the rejection region and the P value is 0.05, so we reject Ho and the HA is accepted. - If the calculated test criterion value is lower than the theoretical value of the level of significance point so we fall in the acceptance region and the P value is >0.05, so we accept Ho.
inference) on the basis of level of significance is deciding difference observed is due to chance or due to some other known factors. The value of the calculated test statistic tells us to reject Ho if it falls in the rejection region (larger than the value determined by ) and not to reject (or accept) Ho if the calculated value falls in the acceptance region (less than the value determined by ). Drawing of the conclusion (or whether the
7- Conclusion; -If Ho is rejected so we conclude that HA is true. -If Ho is not rejected so we conclude that Ho may be true. Meaning of statistically significant and statistically not significant results; statistical significance is not synonymous with biologic or clinical relevance, conversely, the failure to demonstrate statistical significance does not rule out the existence of a clinically important difference populations. between two
Any difference, however small, may be found statistically significant (unlikely to have occurred by random chance) if the sample size (n) is sufficiently large. However, a difference of small magnitude, while statistically significant, may not be clinically important. Hypothesis testing purpose is to assist us in making decision, we must emphasize that, however, the outcome of the statistical test is, it represent only one of evidence that influence our decision. The statistical decision should not be interpreted as definitive, but should be considered along with all the other relevant information available to the researcher (pathological, medical, cytological, microbiological, and immunological, etc .).


")


; Or it is the")


 Decision of reject or accept Ho;")
 on the basis of level of")
 on the basis of level of")