Understanding Index Numbers for Economic Analysis
Learn the basics of index numbers for economic analysis, including calculating index numbers, interpreting data on UK house prices, real disposable income trends, gas prices index, and inflation calculations using the consumer prices index in the UK.

Download Presentation

Please find below an Image/Link to download the presentation.
The content on the website is provided AS IS for your information and personal use only. It may not be sold, licensed, or shared on other websites without obtaining consent from the author. If you encounter any issues during the download, it is possible that the publisher has removed the file from their server.
You are allowed to download the files provided on this website for personal or commercial use, subject to the condition that they are used lawfully. All files are the property of their respective owners.
The content on the website is provided AS IS for your information and personal use only. It may not be sold, licensed, or shared on other websites without obtaining consent from the author.
E N D
Presentation Transcript
Handling Economic Data Index Numbers EdExcel AS Economics 2.1.1
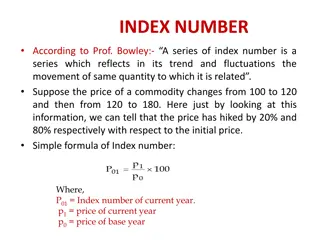
Basics of Index Numbers Examples 1. Index numbers are a useful way of expressing economic data time series and comparing / contrasting information 2. An index number is a figure reflecting price or quantity compared with a base value 3. The base value always has an index number of 100 4. The index number is then expressed as 100 times the ratio to the base value 5. Note that index numbers have no units e.g. , Euros or $ FTSE-100 Share Index Consumer Prices Index (CPI) Exchange Rate Index Index of House Prices Index of Property Rents Index of GDP or GNI Human Development Index (HDI) Index of Production in Manufacturing
Calculating an Index Number Index number in Year Y = (Data Value in Year Y / Base Year Value)*100 Index of UK House Prices (2007=100) Average UK House Price ( s) Year 2007 192,651 100.0 The chosen base year 2008 194,658 101.0 2009 159,961 82.2 Large fall housing slump 2010 167,973 105.0 2011 162,915 97.0 2012 161,648 99.2 A recovery in house prices but little higher than 2007 2013 163,593 101.2
Index Numbers: UK Real Disposable Income Per Head Data is for the 1st quarter of each year Real Disposable Income Per Capita Year The table shows annual figures for real disposable income per head Real disposable income measures incomes adjusted for taxes and benefits and also adjusted for the effects of inflation The base year for the data is 2010 The data shows that real disposable income per head of population fell in 2011 and 2012. This indicates a decline in the standard of living Real Disposable Income per head recovered in 2015 but remains below the 2010 level. 2008 100.1 2009 97.8 2010 100.0 2011 98.5 2012 95.8 2013 97.1 2014 96.5 2015 98.4 Source: Office for National Statistics, July 2015
Index Numbers: Index of Gas Prices in the UK Source: Office for National Statistics, July 2015 300 249.7 250 238.4 221.4 Consumer price index 200.4 191.4 200 180.8 168.7 141.3 150 131.3 100 100 87.5 81.7 50 0 2003 2004 2005 2006 2007 2008 2009 2010 2011 2012 2013 2014 The chart shows an index of consumer prices for gas in the UK from 2003 to 2014 The base year for the consumer price index is 2005, i.e. the CPI in this year = 100 Gas prices have risen strongly over recent years, the highest rate of inflation was in 2006 when the index of gas prices rose by 31.3%.
CPI: How is the Rate of Inflation Calculated? Inflation in the UK is measured by the consumer prices index (CPI) A base year is selected and a family expenditure survey is carried out the survey covers over 40,000 households A representative basket of goods and services used and weights are attached to each item - based on these items importance in people s expenditure as measured the family spending survey Each month government officials collect 120,000 separate price quotations in 141 locations of around 600 products Weights are multiplied by price changes - the weighted price changes are then totalled to calculate the inflation rate At the start of each year the weights used to compile both the CPI are updated using the latest information on household spending
Weights in the Consumer Prices Index (2013) Brought into CPI in 2013 White rum Continental meats E-readers Daily disposable contact lenses Hot chocolate Taken out of CPI in 2013 The shopping baskets of items used in the Consumer Prices Index (CPI) are reviewed each year. Some items are taken out and some are brought in to make sure the CPI is up to date and more representative of consumer spending patterns Champagne Gas barbeques Pairs of soft contact lenses Round lettuces
Handling Economic Data Index Numbers EdExcel AS Economics 2.1.1


")