Explore how to solve and graph linear inequalities, including identifying terms, variables, constants, and coefficients in expressions. Learn to write and graph various inequalities, with practical examples and tips for effective problem-solving. Master the skill of handling inequalities to excel in algebra.
Please find below an Image/Link to download the presentation.
The content on the website is provided AS IS for your information and personal use only. It may not be sold, licensed, or shared on other websites without obtaining consent from the author. If you encounter any issues during the download, it is possible that the publisher has removed the file from their server.
You are allowed to download the files provided on this website for personal or commercial use, subject to the condition that they are used lawfully. All files are the property of their respective owners.
The content on the website is provided AS IS for your information and personal use only. It may not be sold, licensed, or shared on other websites without obtaining consent from the author.
E N D
Presentation Transcript
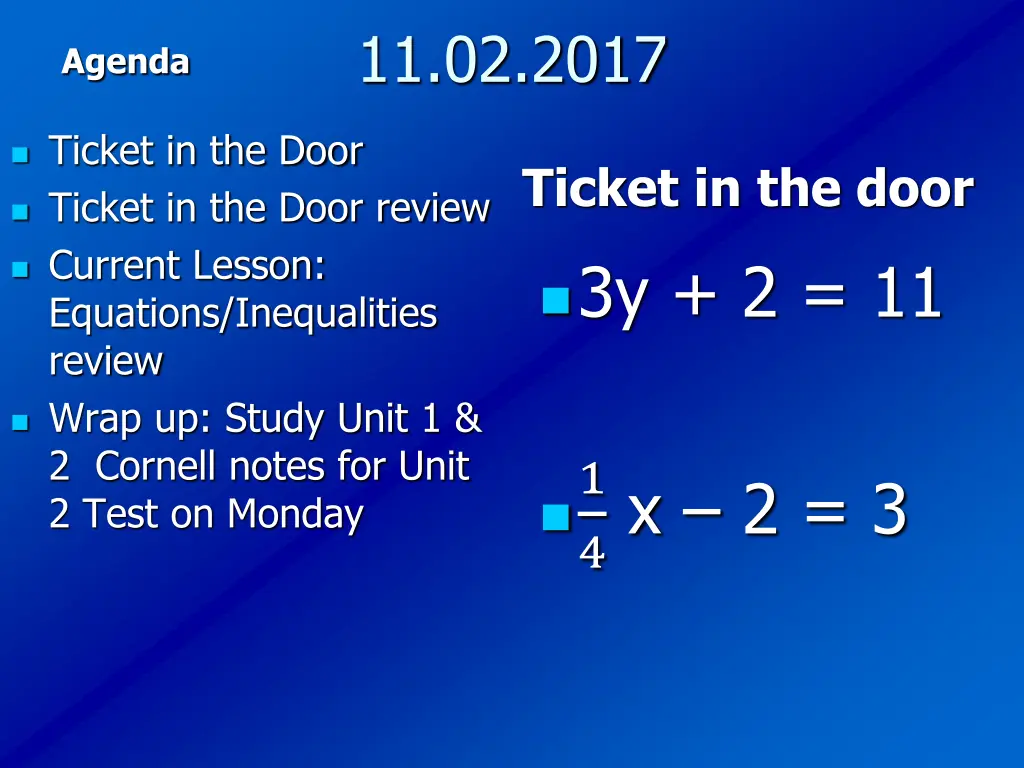
11.02.2017 Agenda Ticket in the Door Ticket in the Door review Current Lesson: Equations/Inequalities review Wrap up: Study Unit 1 & 2 Cornell notes for Unit 2 Test on Monday Ticket in the door 3y + 2 = 11 1 4x 2 = 3
Expression Review: 8x + 7 3K+9j+7+15 How many terms are in the expression? List all variables in the expression. List all constants in the expression. List all coefficients in the expression.
Inequalities: Inequalities: Less than Greater than Less than or equal to Greater than or equal to < > x<5 x>-2 x 3 x 0
To graph Inequalities: To graph Inequalities: Use an open circle for < or > then shade the line in for which direction it will go. Use a closed circle for or for which direction it will go. then shade the line in Example: 1 2 3 4 5 6 x< 4
write and graph each of the write and graph each of the following inequalities. following inequalities. The summer temperature T, in Phoenix is greater than or equal to 80 degrees. T 80 degrees 77 78 79 80 81 82 The average snow fall is less than one inch. S < 1 inch -2 -1 0 1 2 3 4 The class average is greater than or equal to 85%. A 85% 82 83 84 85 86 87
Tips to Solving Tips to Solving Linear Inequalities: Linear Inequalities: Solve just like an equation Get the variable alone on one side Remember if you multiply or divide by a negative number to get the variable alone, reverse (change) the inequality symbol!
Example: 2x + 3 > 4 As an equation 2x + 3 = 4 -3 -3 2x = 1 2 2 x = As an inequality 2x + 3 > 4 - 3 -3 2x > 1 2 2 x > 1 1 2 2 Notice the x value is the same. Now graph your answer. 0 1 2 3
x + 3 2(x-4) x + 3 2x 8 -x -x 3 x 8 +8 +8 11 x 8 9 10 11 12 13 14 15
In Owego, NY, the temperature in January may not exceed 0 degrees C. Write an inequality that describes temperature T for the month and graph it. T 0 -2 -1 0 1 2 3 4


")