Understanding K-Means Clustering Algorithms
Explore the concepts behind K-Means and K-Means Parallel algorithms, including the process of choosing K centers, updating center matrices, and calculating distances. Learn about seeding, clustering methods, and the iterative steps involved in finding optimal cluster centers.

Download Presentation

Please find below an Image/Link to download the presentation.
The content on the website is provided AS IS for your information and personal use only. It may not be sold, licensed, or shared on other websites without obtaining consent from the author. If you encounter any issues during the download, it is possible that the publisher has removed the file from their server.
You are allowed to download the files provided on this website for personal or commercial use, subject to the condition that they are used lawfully. All files are the property of their respective owners.
The content on the website is provided AS IS for your information and personal use only. It may not be sold, licensed, or shared on other websites without obtaining consent from the author.
E N D
Presentation Transcript
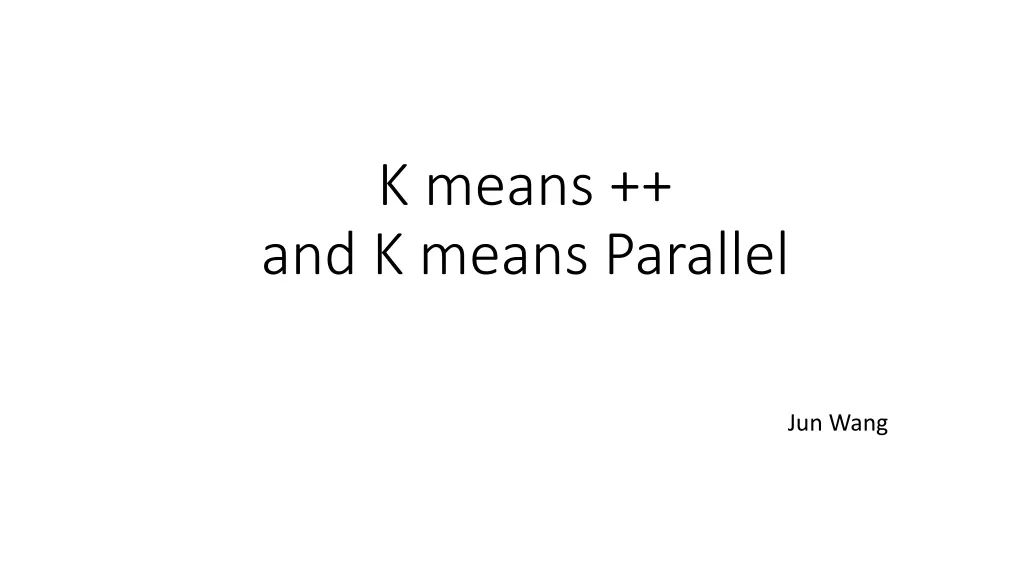
K means ++ and K means Parallel Jun Wang
Review of K means Simple and fast Choose k centers randomly Class points to its nearest center Update centers
K means ++ Actually you are using it Spend some time on choosing k centers(seeding) Save time on clustering
K means ++ algorithm Seeding Choose a center from X randomly For k-1 times Sample one center each time from X with probability p Update center matrix Clustering
Calculate Pi D=d12+d22+d32+ +dn2 Pi=di2/ D Pi=1 Points further away from red point have better chance to be chosen
Keep doing the following: Update center matrix Calculate di2 Calculate pi Until k centers are found
K means || algorithm Seeding Choose a small subset C from X Assign weight to points in C Cluster C and get k centers Clustering
Choose subset C from X Let D=Sum of square distance=d12+d22+d32+ +dn2 Let L be f(k) like 0.2k or 1.5k for ln(D) times Pick up each point in X using Bernoulli distribution P(chosen)=L*di2/D Update the C
How many data in C? Ln(D) iterations Each iteration there suppose to be 1*P1+1*P2+ +1*Pn =L points Total Ln(D)*L points
Cluster the subset C Red points are in subset C
Cluster the sample C Calculate distances between point A to other points in C, and find the smallest distance In this case ,d_c1
Cluster the sample C Calculate distances between point A and all points in X, and get d_xi
Cluster the sample C Compare d_xito d_c1, and let WA=number of d_xi<d_c1 Then we get weight matrix, W Cluster W into k clusters, get k centers
Difference among three methods K means K means ++ K means || seeding choose k centers randomly Choose k centers proportionally Choose subset C and get k centers from C clustering
Hypothesis K means K means ++ K means || seeding choose k centers randomly fast Choose k centers proportionally slow Choose subset C and get k centers from C slower clustering
Hypothesis K means K means ++ K means || seeding choose k centers randomly fast Choose k centers proportionally slow fast Choose subset C and get k centers from C slower faster clustering slow
Test Hypothesis Toy data one very small Cloud data small Spam data moderate Toy data two very large
Simple data set N=100; d=2; k=2; Iteration=100 50 40 30 20 10 0 -10 -20 -30 -40 -50 -40 -20 0 20 40 60 80 100 120 140
Executive time 0.4 0.364668 0.35 0.3 0.25 0.2 0.15 0.1 0.076458 0.067244 0.05 0 K means K means ++ K means ||
Cloud data consists of 1024 points in 10 dimension k=6 200 150 100 50 0 -50 -100 -150 -200 -250 -500 0 500 1000 1500 2000 2500
250 250 250 200 200 200 150 150 150 100 100 100 50 50 50 0 0 0 -50 -50 -50 -100 -100 -100 -150 -150 -150 -200 -200 -200 -500 0 500 1000 1500 2000 2500 -500 0 500 1000 1500 2000 2500 -2500 -2000 -1500 -1000 -500 0 500
Executive time (in seconds) 0.35 0.3 0.25 0.2 0.15 0.1 0.05 0 K means K means ++ K means ||
Total scatter 2.50E+06 2.00E+06 1.50E+06 1.00E+06 5.00E+05 0.00E+00 K means K means ++ K means ||
Spam base data represents features available to an e-mail spam detection system consists of 4601 points in 58 dimensions K=10
Executive time 3.5 3 2.5 2 1.5 1 0.5 0 K means K means++ K means ||
Total scatter 4.50E+07 4.00E+07 3.50E+07 3.00E+07 2.50E+07 2.00E+07 1.50E+07 1.00E+07 5.00E+06 0.00E+00 K means K means ++ K means ||
Complicate data set N=20,000 d=40 K=40 4 x 10 8 6 4 2 0 -2 -4 -6 -8 -1 -0.8 -0.6 -0.4 -0.2 0 0.2 0.4 0.6 0.8 1 5 x 10
Executive time 800 700 600 500 400 300 200 100 0 K means K means++ K means||
Clustered figure with true label 4 x 10 8 6 4 2 0 -2 -4 -6 -8 -1 -0.8 -0.6 -0.4 -0.2 0 0.2 0.4 0.6 0.8 1 5 x 10
Clustered figure with computed label 4 x 10 8 6 4 2 0 -2 -4 -6 -8 -1 -0.8 -0.6 -0.4 -0.2 0 0.2 0.4 0.6 0.8 1 5 x 10
summary K means K means ++ K means || Small size data Fast Very fast Slow Moderate size Large size data Slow Very slow Fast
Select L Does not matter much when data is small Try on large data set 100 80 60 40 20 0 L=0.2k L=1k L=1.5K L=2k


")


")