Understanding Metrics in Software Development
Explore the concept of metrics in software development, including classification, scales, structural models, theoretical and empirical validation, and the significance of time sheets for process improvements. Learn about different types of metrics and their impact on managing, appraising, assuring, controlling, and improving software development processes. Gain insights into the theoretical and practical aspects of validating metrics and leveraging empirical data for correlation analysis and cause-effect models.

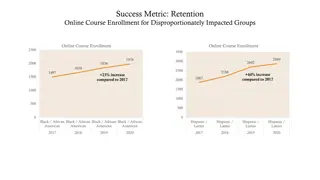
Download Presentation

Please find below an Image/Link to download the presentation.
The content on the website is provided AS IS for your information and personal use only. It may not be sold, licensed, or shared on other websites without obtaining consent from the author. If you encounter any issues during the download, it is possible that the publisher has removed the file from their server.
You are allowed to download the files provided on this website for personal or commercial use, subject to the condition that they are used lawfully. All files are the property of their respective owners.
The content on the website is provided AS IS for your information and personal use only. It may not be sold, licensed, or shared on other websites without obtaining consent from the author.
E N D
Presentation Transcript
Metrics Kristian Sandahl
2021-01-25 Metrics/K Sandahl Introduction Motivation: Management: Appraisal (What do we have?) Assurance (Predict the level by process choice) Control (Takin corrective action) Improvement (Increase quality, lower variance) Research: Cause-effect models Terms: Metric Measurement
2021-01-25 Metrics/K Sandahl Classification Product metrics: Observable or computed properties of the product Examples: Lines of code, number of pages Process metrics: Properties of how you are developing the product Examples: Cycle time for a change request, number of parallel activities Resource metrics: Properties and volumes of the instruments you are using when developing the product Examples: Years of education, amount of memory in testing environment
2021-01-25 Metrics/K Sandahl Scales Examples = , Nominal Categories Type of software Ordinal < , > Rankings Skill rating: high, medium, low %less bugs project delay Interval + , - Differences Ratio / Absolute zero Lines of code
2021-01-25 Metrics/K Sandahl Structural model of measurement
2021-01-25 Metrics/K Sandahl Theoretical validation of metrics Representational theory, based on the mapping between attributes of real-world entities numerical values and units: For an attribute to be measurable, it must allow different entities to be distinguished from one another. A valid measure must obey the representational condition. Different entities can have the same attribute value. B. Kitchenham, S. L. Pfleeger and N. Fenton, "Towards a framework for software measurement validation," in IEEE Transactions on Software Engineering, vol. 21, no. 12, pp. 929-944, Dec. 1995. doi: 10.1109/32.489070
2021-01-25 Metrics/K Sandahl Empirical (external) validation of metrics Correlation between internal and external attributes Cause-effect models Statistical analysis Handle bias
2021-01-25 Metrics/K Sandahl Time sheets provide a powerful source for process improvements Sprint 1 Nisse Stina Pelle Requirement 15 10 0 Well defined categories is a strength. Nisse 10 Stina 20 Pelle Design 10 Requirement Implementation 15 10 0 155 210 355 Design 10 10 20 Test 100 150 240 Implementation Administration 155 210 355 10 10 25 Test 100 150 240 Administration 10 10 25
2021-01-25 Metrics/K Sandahl Halstead s software science1/2 The measurable and countable properties are : n1= number of unique or distinct operators appearing in that implementation n2= number of unique or distinct operands appearing in that implementation N1= total usage of all of the operators appearing in that implementation N2= total usage of all of the operands appearing in that implementation http://yunus.hacettepe.edu.tr/~sencer/complexity.html
2021-01-25 Metrics/K Sandahl Halstead s software science2/2 Equations: Vocabulary n = n1+ n2 Implementation length N = N1+ N2 Length equation: N ' = n1log2n1+ n2log2n2 Program Volume V = Nlog2n Potential Volume V ' = ( n*1+ n*2 ) log2( n*1+ n*2) Program Level L = V / V L ' = n*1n2/ n1N2 Elementary mental discriminations E = V / L = V2/ V ' Intelligence Content I = L ' x V = ( 2n2/ n1N2) x (N1+ N2)log2(n1+ n2) Time T ' = ( n1N2( n1log2n1+ n2log2n2) log2n) / 2n2S
2021-01-25 Metrics/K Sandahl Chidamber & Kemerer object-oriented metrics suite WMC weighted methods per class DIT depth of inheritance tree NOC number of children CBO coupling between object classes RFC response for a class LCOM1 lack of cohesion of methods https://www.aivosto.com/project/help/pm-oo-ck.html
2021-01-25 Metrics/K Sandahl Weighted methods per class Count the number of methods per class Try to keep WMC low High WMC: More faults Less reuse Impact of derived classes
2021-01-25 Metrics/K Sandahl Depth of inheritance tree DIT High DIT: Indicates high reuse Middle classes error-prone Recommended max 5-8 0 1 2 3
2021-01-25 Metrics/K Sandahl Number of children High NOC: High reuse of base class Base class requires more testing Misuse of sub- classing Dangerous with high WMC NOC=3
2021-01-25 Metrics/K Sandahl Coupling between object classes Counted as 1 Limit CBO Low reuse Low maintainability Limit 14? CBO = 1 CBO = 2 CBO = 1
2021-01-25 Metrics/K Sandahl Response for a class Let M = number of methods in a class Let R = number of remote methods that can be called by methods in the class RFC = M +R High RFC: Low maintainability Low testability RFC includes all recursive methods in the call tree
2021-01-25 Metrics/K Sandahl Lack of cohesion of methods For each pair (m1, m2) of methods in a class: If m1 and m2 use a disjoint set of instance variables: Increase P with 1 If m1 and m2 use at least one common variable: Increase Q with 1 LCOM1 = {P-Q, if P>Q; 0 otherwise} High LCOM1 : fault prone, low testability Criticized measure, variants exist.
2021-01-25 Metrics/K Sandahl Code metrics in Visual Studio Lines Of Code Cyclomatic Complexity Maintainability Index = 171 5.2*ln(aveV) 0.23*ave(g ) 16.2*ln(aveLOC) Depth Of Inheritance Class Coupling
2021-01-25 Metrics/K Sandahl Function Points - Background First suggested by Albrecht 1979 Captures complexity and size Language independent Can be used before implementation Used as input for estimation Common versions IFPUG v 4.x Competitor MARK II: simpler to count has finer granularity is a continuous measure A closed community Traditionally used for business systems See the pdf in Course Documents on Lisam
2021-01-25 Metrics/K Sandahl COSMIC-FFP (COmmon Software Measurement International Consortium Full Function Point) An ISO-approved method for calculating FP for embedded, real-time systems Partitions the system in Functional User Requirements (FUR)
2021-01-25 Metrics/K Sandahl Example: Change customer data in a warehouse of items User entry Entry 1 Retrieve customer data Read 1 Display error message Exit 1 Display customer data Exit 1 Enter changed data Entry 1 Retrieve item data Read 1 Store item data Write 1 Store modified data Write 1 Total Cfsu 8
2021-01-25 Metrics/K Sandahl Connections to other methods Mapping to UML Use cases as Sequence diagrams, count messages Cfsu = C1+ C2FP, for less than 100 Cfsu C21.1-1.2 C1varies Are FP valid?
2021-01-25 Metrics/K Sandahl Change-based metrics: Code churn Code churn 600 500 400 300 200 100 0 1/28/2019 1/29/2019 1/30/2019 1/31/2019 2/1/2019 2/2/2019 2/3/2019 2/4/2019 2/5/2019 2/6/2019 2/7/2019 2/8/2019 2/9/2019 2/10/2019 2/11/2019 2/12/2019 2/13/2019 2/14/2019 2/15/2019 2/16/2019 2/17/2019 2/18/2019 2/19/2019 2/20/2019 2/21/2019 2/22/2019 2/23/2019 Lines added Lines modified Lines deleted
Measure usability? 2021-01-25 Metrics/K Sandahl
2021-01-25 Metrics/K Sandahl System Usability Scale (SUS) 1. 2. 3. 4. I think that I would like to use this system frequently. I found the system unnecessarily complex. I thought the system was easy to use. I think that I would need the support of a technical person to be able to use this system. I found the various functions in this system were well integrated. I thought there was too much inconsistency in this system. I would imagine that most people would learn to use this system very quickly. I found the system very cumbersome to use. I felt very confident using the system. 10. I needed to learn a lot of things before I could get going with this system. 5. 6. 7. 8. 9.
2021-01-25 Metrics/K Sandahl Strongly agree Strongly disagree o 1 o 2 o 3 o 5 o 4 For odd question numbers score = answer 1 For even question numbers score = 5 answer SUS score = 2.5 score [0,100] SUS score 68 is considered average
2021-01-25 Metrics/K Sandahl Simplified model with repair time TBF2 TBF1 status TTR1 TTR2 Up and running Being repaired 0 t3 t2 t1 time TTF3 TTF2 TTF1
2021-01-25 Metrics/K Sandahl Reliability growth model The probability that the software executes with no failures during a specified time interval MTTF = Mean Time To Failure Approximation: MTTF/(1+MTTF) Example Easier to manage: Failure intensity, [failures / hours of execution time] Another approximation: = (1-R)/t Example
2021-01-25 Metrics/K Sandahl Similar pattern: Availability and Maintainability Measure Mean Time To Repair (MTTR) and Mean Time To Failure (MTTF) Availability, A: A = MTTF/(MTTF+MTTR) Measure Mean Time To Repair (MTTR) Maintainability, M: M = 1/(1 + MTTR)
2021-01-25 Metrics/K Sandahl Comparing means Under certain conditions: Student s t-test Significance level: nomally 5%
2021-01-25 Metrics/K Sandahl Comparing distributions Are the testers methods the same? Under certain conditions: use the Chi-square test For 2x2 contingency tables other methods apply, for instance Cohen s Kappa
2021-01-25 Metrics/K Sandahl The box plot
2021-01-25 Metrics/K Sandahl Comparing variance
2021-01-25 Metrics/K Sandahl Linear regression
2021-01-25 Metrics/K Sandahl Prediction metrics Prediction of: Resources Calendar time Quality (or lack of quality) Change impact Process performance Often confounded with the decision process
2021-01-25 Metrics/K Sandahl Historical data
2021-01-25 Metrics/K Sandahl Methods for building prediction models Statistical Parametric Non-parametric, robust No assumptions about distribution Less powerful, low degree of automation Rank-sum methods, Pareto diagrams, ... Causal models Link elements with semantic links or numerical equations Simulation models, connectionism models, genetic models, ... Judgemental Organise human expertise Delphi method, pair-wise comparison, Lichtenberg method Make assumptions about distribution of the variables Good tools for automation Linear regression, Variance analysis, ...
2021-01-25 Metrics/K Sandahl The Lichtenbeg method process Staff the analysis group Describe the work to be estimated Define general constraints and assumptions Define the structure Individual judgement of MIN, MAX, LIKLEY Calculate common result (MIN+MAX+3*LIKELY)/5 Find workpagages with large variance Sub-devide them and rework 5-20 participants Never influence each others judgements MIN and MAX should be extreme 1% of the cases
2021-01-25 Metrics/K Sandahl Example of a pareto diagram
Metrics and experimentation/ Kristian Sandahl www.liu.se