Understanding Mnemonic Recall in Statistics Education
Explore the impact of mnemonics on statistical learning and performance based on a study with introductory statistics students. Discover how mnemonic techniques can enhance memory recall and cognitive capabilities in educational settings, facilitating better understanding and application of statistical concepts.

Download Presentation

Please find below an Image/Link to download the presentation.
The content on the website is provided AS IS for your information and personal use only. It may not be sold, licensed, or shared on other websites without obtaining consent from the author. If you encounter any issues during the download, it is possible that the publisher has removed the file from their server.
You are allowed to download the files provided on this website for personal or commercial use, subject to the condition that they are used lawfully. All files are the property of their respective owners.
The content on the website is provided AS IS for your information and personal use only. It may not be sold, licensed, or shared on other websites without obtaining consent from the author.
E N D
Presentation Transcript
What They Remember May Not Be What They Understand: A Study of Mnemonic Recall and Performance by Introductory Statistics Students CAUSE webinar 9/17/2024
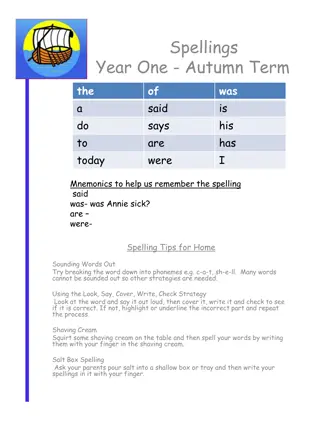
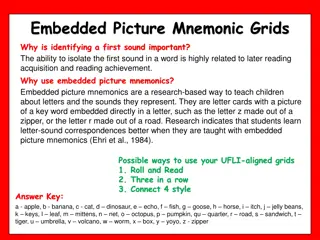
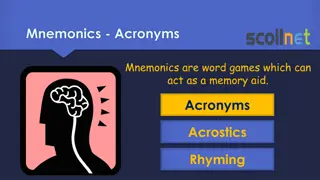
A technique (25 centuries old!) used to assist memory in recalling a fact or a process Collections in statistics: Hunt (2010), Lesser (2011), Stalder & Olson (2011) EXAMPLES: Acronym from first letters: PHANTOM Problem Hypotheses Assumptions Name of Test Test Statistic Obtain a p-value Make a conclusion What is a mnemonic? Sentence mnemonic In a left-skewed distribution, the tail points to the lower values.
Prior research (mostly surveys) on statistics mnemonics vanVoorhis (2002), in Teaching of Psychology Stalder and Olson (2011), in Teaching of Psychology Mocko et al. (2017), in JSE (now JSDSE)
Students cannot apply what they understand if they do not remember it. Moreover, a good memory expands the repertoire of cognitive capabilities upon which new understandings can be developed and expedited. Effective thinking does not occur in a vacuum. William Klemm (2007, p. 61)
The research questions Open Recall: Which mnemonics do students recall more often? 1. Self-Reported Familiarity: Which mnemonics do students state familiarity? 2. Explained when Cued: Which mnemonics do more students explain when given the mnemonics as a cue? 3. Apply: What mnemonics do students apply correctly to exam-like questions given on the extra-credit surveys that would benefit from using mnemonics? 4. Associations: What is the association between Open-Ended Recall and Application as well as between Explained When Cued and Application for the 14 mnemonics in the study? Is there a difference between acronyms and more prolonged(e.g., sentence or song) mnemonics? 5. Predictive of Explained when Cued: Do the self-reported scores predict objective measures in memory? 6. Predictive of Application: Do the self-reported scores predict objective measures in performance? 7.
Data Collection in 2017 Time Point 1 2 3 4 1-7 8-14 1-14 1-14 Mnemonics 1 2 1 and 2 1 and 2 Associated Exam(s) October 2 November 6 December 9 December 9 Exam Date October 2 and 4 Computer Lab November 7 November 20 Nov. 27 - Dec. 6 Survey Date(s) Computer Lab Computer Lab Online Survey Location 136 (6.7%) 164 (8.1%) 152 (7.5%) 868 (43.1%) Students Taking Survey (% of class)
1. Recall: Which mnemonics do students recall more often when asked to list mnemonics to which they have been exposed? Time Point 1 SOCS (60.1%) When summarizing a dataset or describing a histogram, remember to talk about SOCS Spread,Outliers,Center, Shape BINS (50.0%) Binary outcomes,Independent outcomes, Number of trials fixed in advance,Same chancep of success on each trial. Time Point 2 PHANTOM (51.2%) Parameter, Hypotheses,Assumptions,Name of Test,Obtain a p-value,Make a conclusion. PANIC (25.6%) Don t PANIC, because you know the steps. Parameter, Assumptions,Name of interval, Interval, make a Conclusion.
Time Point 1 3. Explained when Cued: Out of the mnemonics assessed at that time point, which mnemonics do more students explain when given the mnemonics as a cue? Population Population and Parameters both start with p ; Sample and Statistic both start with s . X axis The explanatory variable is on the X axis. Left skewed Data that is skewed Left has a tail that goes to the Lower numbers. Time Point 2 P-value decision Hypothesis testing based on p-value: If the p-value is low, the null must go. Three-way tie for t vs. z, Null and df The t table is for tiny sample sizes, and the Z table is for sizeable samples. Ho is what we Hold onto unless we get enough evidence to reject it, in which case the researcher is Happy because the evidence supports Ha (which is the hypothesis she was trying to prove ). With degrees of freedom, you step down. The d is for degrees and down.
4. Apply: What mnemonics do students apply correctly to exam-like questions (on the extra-credit surveys) that would benefit from using mnemonics? Time Point 1 X axis Left skewed Time Point 2 t vs. z P-value decision df
Open recall, correct, and use for time points 1 and 3 RQ 1 RQ 4 RQ 2
Recommendations for Teaching Help students transition from recall to application. Don t assume a student can apply a mnemonic just because they remember it.
Next Steps Methods of presenting mnemonics for easier recall Training of teaching assistants for the use of mnemonics Relationship between question difficulty and applicability of mnemonic use Relationship between mnemonic use and statistical anxiety Role of mnemonics in problem solving Creation of mnemonics
Selfreported familiarity how well they remembered the memory aid from class how likely they were to think of the mnemonic if they needed to solve a problem or remember information for a test if they thought that they could apply it
Time Point 1 Population Population and Parameters both start with p ; Sample and Statistic both start with s . X axis The explanatory variable is on theX axis. Left skewed Data that is skewedLeft has a tail that goes to the Lower numbers. 2. Self-Reported Familiarity: With which mnemonics d o students state familiarity? Time Point 2 P-value decision Hypothesis testing based on p-value: If thep-value is low, the null must go. t vs. z Thet table is for tiny sample sizes and the Z table is for sizeable samples.
Self-Reported Familiarity for mnemonics 1 7 time points 1 and 3 Red (1) is low Dark Blue (7) is high
5. Associations: What is the association between Open-Ended Recall and Application as well as between Explained When Cued and Application for the 14 mnemonics in the study? Is there a difference between acronyms and longer (e.g., sentence or song) mnemonics? Students could move through levels of Bloom s Taxonomy. Students could recall, explain, and apply.
6. Predictive of Explained when Cued: Do the self-reported scores predict objective measures in memory? Students who were more likely to say that they could remember it were also more likely to explain it.
6 &7. Predictive of Explained when cued/Application: Do the self-reported scores predict objective measures in memory/performance? Cramer s V effect sizes reported in this figure


 used to assist")
")
")