Understanding National Education Accounts and Their Impact on Education Financing
Discover the importance of National Education Accounts (NEA), their role in analyzing education financing, and how they help in transparency and decision-making. Explore insights from the NEA workshop and findings from Nigeria's SEAs.

Download Presentation

Please find below an Image/Link to download the presentation.
The content on the website is provided AS IS for your information and personal use only. It may not be sold, licensed, or shared on other websites without obtaining consent from the author. If you encounter any issues during the download, it is possible that the publisher has removed the file from their server.
You are allowed to download the files provided on this website for personal or commercial use, subject to the condition that they are used lawfully. All files are the property of their respective owners.
The content on the website is provided AS IS for your information and personal use only. It may not be sold, licensed, or shared on other websites without obtaining consent from the author.
E N D
Presentation Transcript
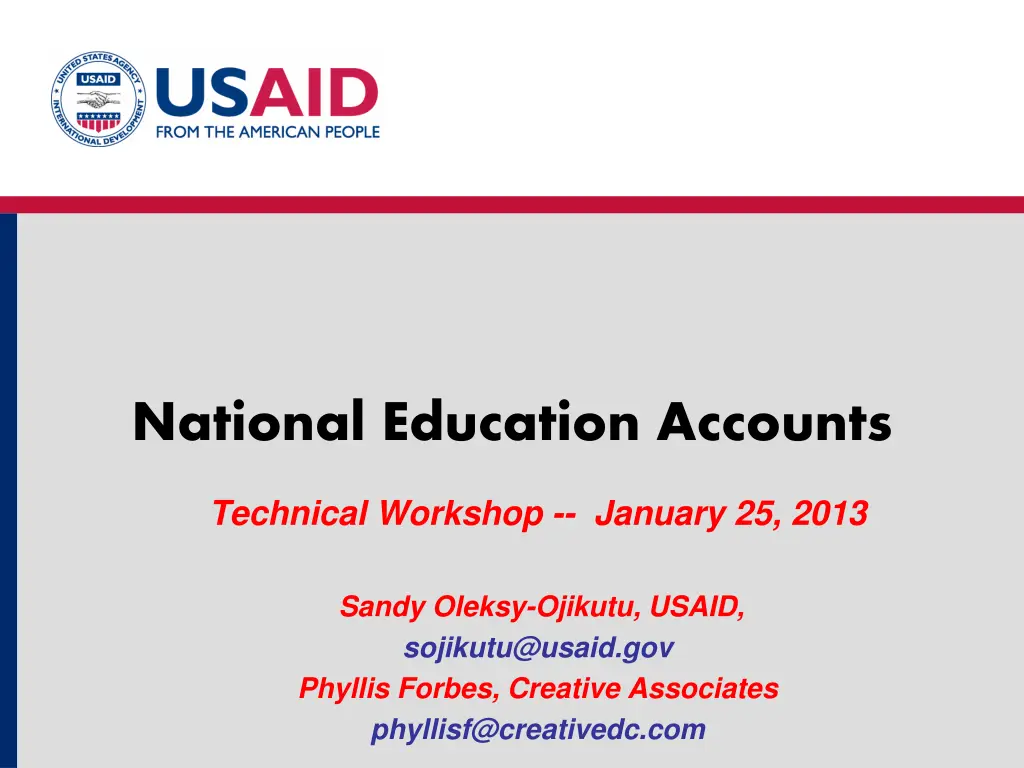
National Education Accounts Technical Workshop -- January 25, 2013 Sandy Oleksy-Ojikutu, USAID, sojikutu@usaid.gov Phyllis Forbes, Creative Associates phyllisf@creativedc.com
What Are National Education Accounts? What Are National Education Accounts? Adapted from National Health Adapted from National Health Accounts Accounts Compare education expenditures to Compare education expenditures to policy directions policy directions All sources of funding: public, All sources of funding: public, private, donor private, donor Financing flow through education Financing flow through education system system 2
NEA Answers Four Key Questions: NEA Answers Four Key Questions: 1. 1. Who is financing education? Who is financing education? 2. 2. How much do they spend? How much do they spend? 3. 3. How are funds distributed to How are funds distributed to education providers? education providers? 4. 4. How are funds used? How are funds used? 3
Nigeria SEA Nigeria SEA 4
Nigeria SEA Nigeria SEA Four States in Northern states Kano, Zamfara, Bauchi and Sokoto Bauchi & Sokoto: two rounds of SEA Nigeria Similar cultures Different priorities Different expertise +Sub Account conducted on non-formal, Almajiri schools 5
Major Findings SEA Major Findings SEA Kano and Sokoto spent 29 and 26% of state budget on education Zamfara and Bauchi 17-18%. Average per student expenditure was higher in Sokoto than the other three states 50% expenditures on primary school About 20% private and 80% public sources 2005- 09, Bauchi was 43% private and 56% public in 2010 6
Significance of SEA Significance of SEA Automated data base helps Xray for transparency and accountability Ability to compare within State or between States Develop capacity of Ministry staff using evidence for decision making Speaks truth to power 7
Financing Sources Financing Sources - - Percent Public, Private, Percent Public, Private, Donor Donor 8
State Contribution to Education Funding State Contribution to Education Funding Kano 05/06 Zamfara 06/07 in Billions of Naira Bauchi 08/09 Sokoto 09/10 Total Expenditure on Education In State Total Expenditure on Education By State 27.2 21.2 35.4 33.7 14.5 8.5 14.7 18 Total State Expenditures 49.2 47.9 83.4 68.4 Percent Total State Expenditures Allocated to Education 9 29% 18% 17% 26%
Average Expenditures: Average Expenditures: All Students, Public School & Private School All Students, Public School & Private School 70,000 60,000 50,000 40,000 Naira 30,000 20,000 10,000 0 ALL students Public school Private school Kano 05/06 9.4m Zamfara 06/07 3.3m Population: 10
Comparison: Financing Sources Bauchi Bauchi SY 08/09 Bauchi SY 10/11 World 2% World 0% Private 26% Private 42% Public 56% Public 74% Changesin financing sources from first SEA in SY 08/09 to second SEA in SY 0-10/11 11
Financing Sources Financing Sources 60 50 40 30 20 10 0 Federal State LGA Household Private Rest (Int'l & donor) Kano 05/06 Zamfara 06/07 Bauchi 08/09 Sokoto 09/10 12
Distribution By Sectors Distribution By Sectors 60 50 40 30 20 10 0 Capital Investment Recurrent Personnel Maintenance Transfer Recurrent Running Kano 05/06 Zamfara 06/07 Bauchi 08/09 Sokoto 09/10 13
Distribution to Providers: Education Level Distribution to Providers: Education Level 50 45 40 35 30 25 20 15 10 5 0 preprimary Primary Secondary Tertiary Admin Kano 05/06 Zamfara 06/07 Bauchi 08/09 Sokoto 09/10 14
Distribution to Providers: Public School & Private Distribution to Providers: Public School & Private Schools Schools 15
Household Expenditures Compared Kano, Zamfara, Household Expenditures Compared Kano, Zamfara, Bauchi Bauchi and and Sokoto Sokoto Total Other Extra Classes School fees Books PTA Uniforms Transport Food - 2,000 4,000 Expenditure in Naira 6,000 8,000 10,000 Zamfara Kano bauchi Sokoto National 16
SEA: Sub Account Almajiri SEA: Sub Account Almajiri Qur anic schools for young students, 1/3 are resident and 2/3 are fixed 1.6m students in Almajiri school in Kano vs. 2.m students in formal sector schools 50% non resident students were girls Parent contribution for Almajiri (N 2,800 per Almajiri student) slightly more than contribution to public schools (N 2,600) Salaries for teachers almost same as gifts to Almajiri (N114,143 for Imam vs. N151,145 mean primary teacher) 17
Nigeria SEA Nigeria SEA Significant Elements Significant Elements NEA completed by State Supported by Nigerian TA team Struggle through local data Working groups work Adapted from NHA Data Base useful for planning
Impact of SEA in Nigeria Impact of SEA in Nigeria Bauchi increased State input from 17% to 26% State budget Zamfara reassigned teachers to rural areas and improved schools for girls Kano transferred funds from construction to maintenance to improve more schools Sokoto Governor initiated school inspections
USAID Experience with NEA USAID has funded 8 Accounts Morocco Kano Zamfara El Salvador Bauchi I Sokoto I Bauchi II Sokoto II 4 Sub accounts Kano Almajiri Zamfara Almajiri\ Bauchi Almajiri Sokoto Almajiri Creative Associates has supported 11 of these studies, RTI supported the El Salvador NEA 20
Morocco NEA Morocco NEA first pilot first pilot 21
Major Findings Morocco NEA Major Findings Morocco NEA Parent contribution (33%) very important for future policy changes Lowest quintile spent 70% non food funds on education Poor spent on access (transport etc.) vs. rich spent on quality (schools and books) Private schools: 5% students uses 20% funds Decentralization of budget but not implementation Rural spent on sending children to school transportation, uniforms, food Urban spent on quality of education private school, books, tutors
USAID NEA Approach USAID NEA Approach Built on National Health Accounts model Builds local capacity Works closely with government and stakeholders Institutionalization critical Forward Planning capacity supports institutionalization Many features developed to promote more capacity and skill transfers 23
Significant NEA Features Significant NEA Features Just in time training State to state support Relational Data Base, Automated matrices and graphics Framework Document defines blue print and reinforces team work Data collectors and analysts from line offices Stakeholders and program directors involved Analytical workshop where data meets reality Report workshop to complete NEA
NEA Organization NEA Organization Boundaries Policy Working Group Steering Committee Data Map Analysis Final Report Working Group Data collection Validation Analysis Core Data Group
NEA Just NEA Just- -in in- -Time Training Time Training Phase Training Phase 1 - Local Buy in and organization Orientation Framework (boundaries) Data mapping Phase 2- Data Collection Data collection (private, public & donor) Data entry Validation Data analysis Report Preparation Phase 3 - Analysis & Final Report
NEA Time Frame NEA Time Frame Data Collection Final Report Framework Findings Data Data Analysis Validation Orientation Month 1 Month 2 Month 3 Month 4 Month 5 Month 6 Month 8 27
NEA Framework Document NEA Framework Document Overview of Education System Key Education Concerns/Issues NEA Explained Boundaries & Classifications NEA Organization Work Plan Data Collection Plan Evaluation Plan Technical Assistance Plan
NEA Data Base NEA Data Base ID LGA__id Tframe_Id Sc_ID Ownership_Idnew Ownership_ID INS_id FS_id1 FS_id2 FS_id3 Serial_no Abdu Gusau Polytechnic T/Mafara 647 State of Zamfara 2006 (Jan - Dec) 1Urban Public Public Secular 1Public Funds 2State Govt Parastatal Revenue Abdu Gusau Polytechnic T/Mafara 648 State of Zamfara 2007 (Jan - Dec) 1Urban Public Public Secular 1Public Funds 2State Govt Parastatal Revenue Abdu Gusau Polytechnic T/Mafara 649 State of Zamfara 2006 (Jan - Dec) 1Urban Public Public Secular 1Public Funds 2State Govt Parastatal Revenue Abdu Gusau Polytechnic T/Mafara 650 State of Zamfara 2006 (Jan - Dec) 1Urban Public Public Secular 1Public Funds 1Federal Govt ETF Abdu Gusau Polytechnic T/Mafara 651 State of Zamfara 2006 (Jan - Dec) 1Urban Public Public Secular 1Public Funds 1Federal Govt ETF Abdu Gusau Polytechnic T/Mafara 652 State of Zamfara 2007 (Jan - Dec) 1Urban Public Public Secular 1Public Funds 1Federal Govt ETF Abdu Gusau Polytechnic T/Mafara 653 State of Zamfara Sep.2006 to Dec. 2006 1Urban Public Public Secular 1Public Funds 1Federal Govt ETF Abdu Gusau Polytechnic T/Mafara 654 State of Zamfara Sep.2006 to Dec. 2006 1Urban Public Public Secular 1Public Funds 2State Govt SMOF Abdu Gusau Polytechnic T/Mafara 655 State of Zamfara Jan. 2007 to Aug. 2007 1Urban Public Public Secular 1Public Funds 2State Govt SMOF Abdu Gusau Polytechnic T/Mafara 656 State of Zamfara Jan. 2007 to Aug. 2007 1Urban Public Public Secular 1Public Funds 2State Govt SMOF Abdu Gusau Polytechnic T/Mafara 657 State of Zamfara Sep.2006 to Dec. 2006 1Urban Public Public Secular 1Public Funds 2State Govt SMOF Abdu Gusau Polytechnic T/Mafara 658 State of Zamfara Sep.2006 to Dec. 2006 1Urban Public Public Secular 1Public Funds 2State Govt SMOF Abdu Gusau Polytechnic T/Mafara 659 State of Zamfara Jan. 2007 to Aug. 2007 1Urban Public Public Secular 1Public Funds 2State Govt Parastatal Revenue Abdu Gusau Polytechnic T/Mafara 660 State of Zamfara Jan. 2007 to Aug. 2007 1Urban Public Public Secular 1Public Funds 2State Govt Parastatal Revenue 415Anka LGC State of Zamfara 2006 (Jan - Dec) 2Rural Public Public Secular 1Public Funds 2State Govt SMOF
NEA Matrix NEA Matrix Matrix 1: Sources of Education Financing Matrix 1: Sources of Education Financing Financing Sources Public Funds Private Funds Rest of World Other Grand Total Total 27,963,967,474 7,288,754,499 1,338,173,550 111,422,847 36,702,318,370 Matrix 1.1: Sources of Education Financing detailed by Source Matrix 1.1: Sources of Education Financing detailed by Source Financing Sources Public Funds Financing Sources Federal Govt State Govt Local Govt Total 8,522,639,610 18,317,000,748 1,124,327,116 27,963,967,474 5,922,844,104 166,266,837 1,199,618,558 25,000 7,288,754,499 6,899,800 1,331,273,750 Public Funds Total Private Funds Household NGO Private Org Faith Based Private Funds Total Rest of World International NGO International Multilateral and Bilateral International Religious and Charitable - Rest of World Total Other Grand Total 1,338,173,550 111,422,847 36,702,318,370