Explore the concept of nested designs in experimental research, which involve unique levels of factors nested within each other. Learn about the model, decomposition of sum of squares, and expected mean squares for factor effects.
Please find below an Image/Link to download the presentation.
The content on the website is provided AS IS for your information and personal use only. It may not be sold, licensed, or shared on other websites without obtaining consent from the author. If you encounter any issues during the download, it is possible that the publisher has removed the file from their server.
You are allowed to download the files provided on this website for personal or commercial use, subject to the condition that they are used lawfully. All files are the property of their respective owners.
The content on the website is provided AS IS for your information and personal use only. It may not be sold, licensed, or shared on other websites without obtaining consent from the author.
E N D
Presentation Transcript
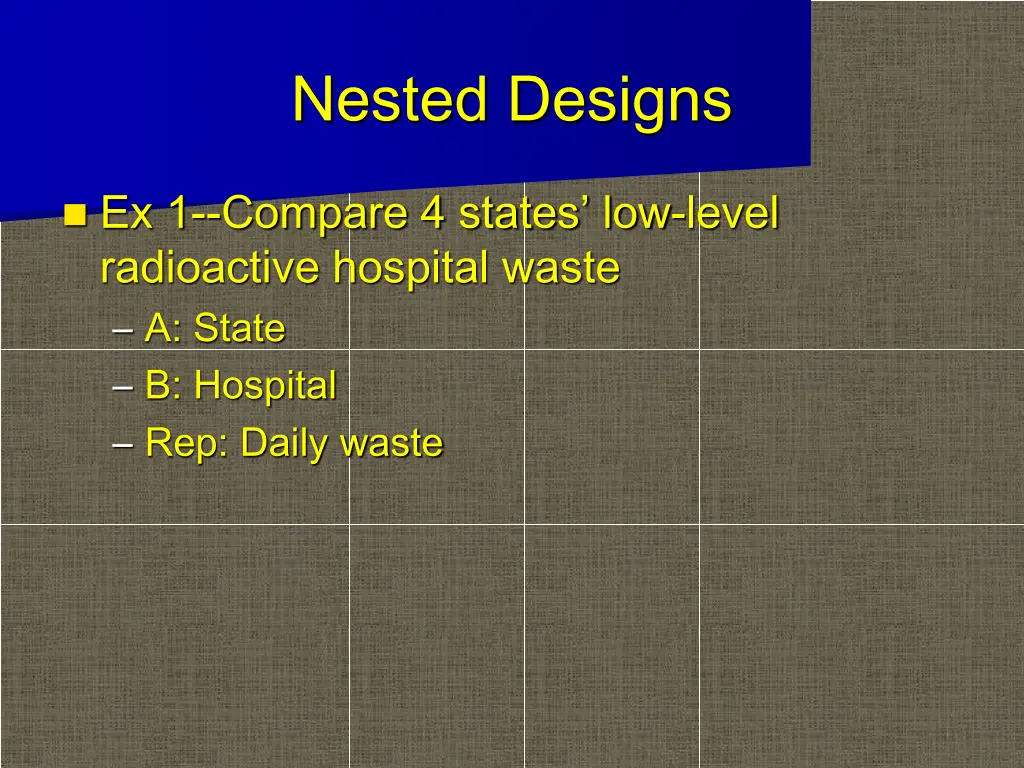
Nested Designs Ex 1--Compare 4 states low-level radioactive hospital waste A: State B: Hospital Rep: Daily waste
Nested Design Examples Ex 2--Compare tobacco yield/acre in 5 counties A: County B: Farm Rep: Field Yield/acre Other Ex--Tick study, Classroom studies Are A and B crossed in these studies?
Nested Designs as Incomplete Designs We say B is nested in A when levels of B are unique (or intrinsic) to a given level of A Nested designs can also be thought of as incomplete factorial designs (with most treatment combinations impossible)
Nested Design Model Typically, A is fixed and B is random = , 1 , i a = + + + = , 1 , Y B j b or b ( ) ( ) ijk i j i k ij i = , 1 , k n or n ij = 2 B (e.g.) 0 ; , 0 ( ) B iid N ( ) i j i
Nested Design SS Decomposition We can decompose the sum of squares: SSTO=SSA+SSB(A)+SSE Y i.. Y ... ( ( ) Yijk Y ... ( ) 2=nb ( i k 2 ) ) 2+ 2 i j i j +n Y ij. Y i.. Yijk Y ij. Note that SSB(A)=SSB+SSAB
Expected Mean Squares All other assumptions being satisfied for an F-test, we can compute Expected Mean Squares (EMS) to construct appropriate F-tests for factor effects
EMS for A = + + + Y B ( ) ( ) ijk i j i k ij = + + + Y B .. .( ) ( ) i i i i = + + + 0 Y B ... .(.) ( ) ( ) ( ) ( ) i i i i 2 2 2 = + + + 2 Y Y B B .. ... ( ) ( ) .( ) .(.) i i i i
SS for A ( ( ) ) ( ) ( ) i i i i 2 2 2 = + + + 2 i Y Y B B ( .. ... ( ) ( ) ( ) ) i i i ( ) ( ) i i i i 2 2 2 2 i Y Y B B ( .. ... ( ) ( ) ( ) ) i i i = + + + 1 1 1 1 a a a a
EMS for A final derivation ( ) 2 Y Y 2 i .. ... i 2 2 B = + + i E 1 1 a a bn b 2 i nb = + + 2 2 B ( ) E MSA n 1 a
EMS for B(A) = + + B + Y B . ( ) ( ) ij i j i ij ( ) ( + ) = Y Y B . .. ( ) ( ) ( ) ( ) ij i j i i ij i
EMS for B(A) Derivation ( ) ( ) = + Y Y B B ( ) i ( ) i ( ) ij ( ) i . .. . . . . ij i j ( ) ( ) i j 2 2 n Y Y Y Y . .. . .. ij i ij i n i j = = E E ) 1 ( 1 a b a b n 2 n n i i + = n + 2 B 2 B 2 a a
ANOVA table Source A df a-1 SS SSA EMS 2 i nb + + 2 2 B n 1 a + n 2 B 2 B(A) a(b-1) SSB(A) Error Total ab(n-1) abn-1 SSE SSTO 2
Example Tobacco Case Study SAS code Minitab Variance Components
Cost Analysis Supposed we want to minimize the variance of our treatment means (for a balanced design) This will depend on the cost of sampling another level of the nested factor vs the cost of adding a replication
Cost analysis Variance + 2 2 ( ) Y i n = B V .. bn The total number of units to be sampled is fixed at bn. If cost isn t a factor, how should these units be allocated?
Cost Breakdown and Constraint Assume we have a fixed project cost C D1= dollars per nested factor level D2= dollars per rep Total cost C=b D1+bn D2
Cost Analysis Allocation Subject to the cost constraint, we minimize + 2 2 n B bn The answer turns out to be D D = 1 2 n B
Power Analysis Note that increasing n does not really improve power for testing treatment effects i 2 i nb = : 0 H o n + 2 B 2


")
 Derivation")