Understanding Network Topology and Quantities in Biomedical Data Science
Explore the concepts of network topology and quantities in biomedical data science, covering aspects such as the degree of nodes, network parameters, clustering coefficients, path lengths, and network motifs. Gain insights into the interconnectedness and characteristics of biological networks through this informative content.
Download Presentation

Please find below an Image/Link to download the presentation.
The content on the website is provided AS IS for your information and personal use only. It may not be sold, licensed, or shared on other websites without obtaining consent from the author. If you encounter any issues during the download, it is possible that the publisher has removed the file from their server.
You are allowed to download the files provided on this website for personal or commercial use, subject to the condition that they are used lawfully. All files are the property of their respective owners.
The content on the website is provided AS IS for your information and personal use only. It may not be sold, licensed, or shared on other websites without obtaining consent from the author.
E N D
Presentation Transcript
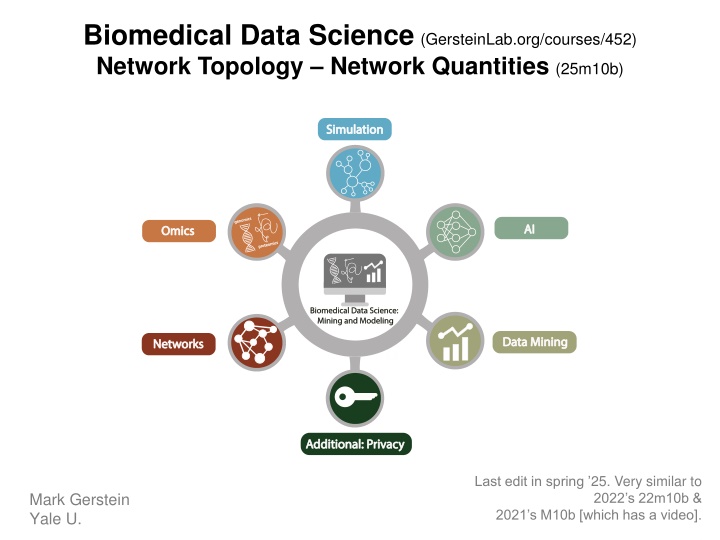
Biomedical Data Science(GersteinLab.org/courses/452) Network Topology Network Quantities (25m10b) (c) M Gerstein, gerstein.info/talks 1 Last edit in spring 25. Very similar to Mark Gerstein Yale U. 2022 s 22m10b & 2021 s M10b [which has a video].
Degree of a node: the number of edges incident on the node i Degree of node i = 5 (c) M Gerstein, gerstein.info/talks 2
Network parameters Number of incoming and outgoing connections Incoming connections = 2.2 each gene is regulated by ~2 TFs In-degree Outgoing connections = 20.2 each TF regulates ~20 genes (c) M Gerstein, gerstein.info/talks 3 Connectivity Out-degree
Clustering coefficient Clustering Coefficient: Ratio of existing links to maximum number of links for neighbouring nodes Example: For A: 3 neighbours A 2 existing link C 3 possible links B Clustering coefficient CA=2/3 D Example from: http://www.learner.org/courses/mathilluminated/units/11/textbook/04.php 4
Clustering coefficient Average Coefficient: Average of clustering coefficients of all nodes n n C = 1 n Ci i=1 Measure of inter-connectedness of the network Global property A Example: Clustering coefficient: CA=2/3 CB=2/3 CC=1/3 CD=1/3 Average coefficient = 1/4(2/3+2/3+1/3+1/3)= 0.5 C B D Example from: http://www.learner.org/courses/mathilluminated/units/11/textbook/04.php 5
Path length Number of edges along a path i Path length = 3 Meaning: 1 Number of intermediate TFs to reach final target Indication of how immediate a response is 2 j 6
Path length Shortest path length: is the minimum number of edges that must be traversed to travel from a vertex i to another vertex j of a graph G ( , ) i j L i = 2 ( , ) i j L Graph Theory Terminology (Batten, pp. 92-105) j Characteristic path length (Average path length ) ( , ) i j L The characteristic path length L of a graph is the average of the for every possible pair (i,j) L = n(n 1) ?(?,?) 1 i,j Networks with small values of L are said to have the small world property http://en.wikipedia.org/wiki/Average_path_length 7
Network motifs Regulatory modules within the network SIM MIM FBL FFL [Alon U, 2007, Nature Reviews Genetics, Network motifs: theory and experimental approaches] 8
FFL = Feed-forward loops SBF Yox1 Pog1 Tos8 Plm2 9 [Alon U, 2007, Nature Reviews Genetics]
1 2 3 4 5 6 7 8 9 10 11 12 13 14 15 16 17 18 19 20 21 22 23 24 25 26 27 28 29 30 31 32 33 34 35 36 37 38 39 40 41 42 43 44 45 46 47 48 49 50 51 52 53 54 55 56 57 58 59 60 61 62 63 64 65 66 67 68 69 70 71 72 73 74 75 76 77 78 79 80 81 82 83 84 Network Motifs 7 Motifs Over-represented 1 2 3 4 5 6 7 8 9 10 11 12 85 86 87 88 89 90 91 92 93 94 95 96 13 14 15 16 17 18 19 20 21 22 23 24 25 26 27 28 29 30 31 32 33 34 35 36 37 38 39 40 41 42 97 43 44 45 46 47 48 98 99 100 101 102 103 104 105 106 107 108 49 50 51 52 53 54 55 56 57 58 59 60 61 62 63 64 65 66 67 68 69 70 71 72 109 110 111 112 113 114 115 116 117 118 119 120 73 74 75 76 77 78 79 80 81 82 83 84 85 86 87 88 89 90 91 92 93 94 95 96 121 122 123 124 125 126 127 128 129 130 131 132 97 98 99 100 101 102 103 104 105 106 107 108 109 110 111 112 113 114 115 116 117 118 119 120 121 122 123 124 125 126 133 127 128 129 130 131 132 134 135 136 137 FFL involving miRNA & 2 TFs 138 139 140 141 142 143 144 133 134 135 136 137 138 139 140 141 142 143 144 145 activate All Motifs TF MIR GENE repress 145 activate TF MIR GENE 10 repress [Science 330:6012; Cheng et al. PLOS CB 11]
Cliques k-cores : For all vertices in a graph G have degree at least k Fully connected sub-components Related measures K [Hogue et al, BMC BIOINFORMATICS, 2003] Problem: High-throughput experiments are prone to missing interactions
One solutiondefective cliques P If proteins P and Q interact with a clique K of proteins which all interact with each other, then P and Q are more likely to interact with each other P, Q, and K form a defective clique Q K Predicting protein interactions by completing defective cliques [Yu et al. Bioinformatics (2006)]
References McGillivray, P., Clarke, D., Meyerson, W., Zhang, J., Lee, D., Gu, M., Kumar, S., Zhou, H., & Gerstein, M. (2018). Annual Review of Biomedical Data Science, 1(1), 153 180. Network analysis as a grand unifier in biomedical data science. https://doi.org/10.1146/annurev-biodatasci-080917-013444 (Section 2.) Lectures.gersteinlab.org

