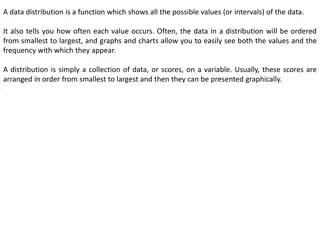
Discover the significance of normal distribution in business statistics, its properties, examples of application, and the mathematical foundation behind it. Explore the bell-shaped curve, symmetrical characteristics, and the role of mean and standard deviation in this fundamental statistical concept.
Please find below an Image/Link to download the presentation.
The content on the website is provided AS IS for your information and personal use only. It may not be sold, licensed, or shared on other websites without obtaining consent from the author. If you encounter any issues during the download, it is possible that the publisher has removed the file from their server.
You are allowed to download the files provided on this website for personal or commercial use, subject to the condition that they are used lawfully. All files are the property of their respective owners.
The content on the website is provided AS IS for your information and personal use only. It may not be sold, licensed, or shared on other websites without obtaining consent from the author.
E N D
Presentation Transcript
BUSINESS STATISTICS Prepared by: Dr. Archana Bhatia HOD, Dept. of Commerce(GIA) DAVCC,FARIDABAD
INTRODUCTION Most important theoretical distribution for continuous variable like height, weight etc. Mathematical equation of normal curve was developed by De Moivre in 1733. Karl Friedrich Gauss became the first person to use properties of normal distribution. Known by several names: Normal curve, Normal frequency distribution, Gauss curve, Normal probability curve.
EXAMPLES: The body temperature for healthy humans The heights and weights of adults. The thickness and dimensions of a product IQ and standardized test scores. Quality control test results. Errors in measurements.
DEFINITION OF NORMAL DISTRIBUTION Normal distribution is defined and given by the following probability function: Where x= value of continuous normal variate =mean of normal random variate = mathematical constant e = base of natural algorithm = standard deviation
GRAPH OF NORMAL DISTRIBUTION Different shapes depending upon on different values of mean and standard deviation. Limiting case of binomial & poisson distribution Total area under curve is 100%(or 1). Mean lies at the centre of distribution. Tails extends indefinitely but never touches horizontal axis. Probability is always positive.
PROPERTIES OF NORMAL DISTRIBUTION Height is maximum at mean value. Normal curve is asymptotic i.e. never touches X axis. Range - to + . No portion of curve lies below X axis.
PROPERTIES OF NORMAL DISTRIBUTION First and third quartiles are equidistant from median M.D. = 4/5 S.D. Q.D.= 2/3 S.D. Q.D:M.D: S.D = 10:12:15
PROPERTIES OF NORMAL DISTRIBUTION For any normally distributed data : 68.26% of data fall within 1 standard deviation of the mean 95.45% of data fall within 2 standard deviation of the mean 99.73% of data fall within 3 standard deviation of the mean
PROPERTIES OF NORMAL DISTRIBUTION Also called 3 statement Has only two parameters : mean & standard deviation Every normal curve has inflection points at exactly 1 standard deviation on each side of the mean
ASSUMPTIONS OF NORMAL DISTRIBUTION Casual forces affecting events must be numerous. Casual forces affecting events must be independent Condition of Symmetry Condition of homogeneity
MEASURING AREA UNDER NORMAL CURVE Any normally distributed data can be converted to the standardised form using the formula : Where, X= data point in question Z= measure of number of standard deviations of that data point from mean.