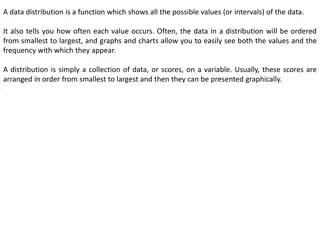
Understanding Normal Distribution in Statistics and Business
Discover the significance of Normal Distribution, commonly known as the bell curve, in statistics, business, and government entities like the FDA. Learn about its characteristics, properties, and examples in various contexts such as test grading systems and data analysis.

Download Presentation

Please find below an Image/Link to download the presentation.
The content on the website is provided AS IS for your information and personal use only. It may not be sold, licensed, or shared on other websites without obtaining consent from the author. If you encounter any issues during the download, it is possible that the publisher has removed the file from their server.
You are allowed to download the files provided on this website for personal or commercial use, subject to the condition that they are used lawfully. All files are the property of their respective owners.
The content on the website is provided AS IS for your information and personal use only. It may not be sold, licensed, or shared on other websites without obtaining consent from the author.
E N D
Presentation Transcript
PROBABILITY AND STATISTICS
Normal Distribution utilized statistics, business settings, and government entities
Introduction:- Normal Distribution:- Normal Distribution is often called a bell curve and is broadly utilized in statistics, business settings, and government entities such as the FDA. It's widely recognized as being a grading system for tests such as the SAT and ACT in high school or GRE for graduate students.
What is a Normal distribution? Normal Distribution is often called a bell curve and is broadly utilized in statistics, business settings, and government entities such as the FDA. It's widely recognized as being a grading system for tests such as the SAT and ACT in high school or GRE for graduate students. Many groups follow this type of pattern. That s why it s widely used in business, statistics and in government bodies like the FDA: Heights of people. Measurement errors. Blood pressure. Points on a test. IQ scores. salaries.
Normal Distribution contains the following characteristics: It occurs naturally in numerous situations. Data points are similar and occur within a small range. Much fewer outliers on the low and high ends of data range.
Properties of a normal distribution The mean, mode and median are all equal. The curve is symmetric at the center (i.e. around the mean, ). Exactly half of the values are to the left of center and exactly half the values are to the right. The total area under the curve is 1.
Examples Of Normal Distribution Examples Of Normal Distribution Tossing A Coin Flipping a coin is one of the oldest methods for settling disputes. We all have flipped a coin before a match or game. The perceived fairness in flipping a coin lies in the fact that it has equal chances to come up with either result. The chances of getting head are 1/2, and the same is for tails. When we add both, it equals to one. If we toss coins multiple times, the sum of the probability of getting heads and tails will always remain 1.
Students Average Report Nowadays, schools are advertising their performances on social media and TV. They present the average result of their school and allure parents to get their child enrolled in that school. School authorities find the average academic performance of all the students, and in most cases, it follows the normal distribution curve. The number of average intelligent student is higher than most other students.
Rolling A Dice A fair rolling of dice is also a good example of normal distribution. In an experiment, it has been found that when a dice is rolled 100 times, chances to get 1 are 15-18% and if we roll the dice 1000 times, the chances to get 1 is, again, the same, which averages to 16.7% (1/6). If we roll two dices simultaneously, there are 36 possible combinations. The probability of rolling 1 (with six possible combinations) again averages to around 16.7%, i.e., (6/36). More the number of dices more elaborate will be the normal distribution graph.
Normal Distribution utilized statistics Normal Distribution is often called a bell curve and is broadly utilized in statistics, business settings, and government entities such as the FDA. It's widely recognized as being a grading system for tests such as the SAT and ACT in high school or GRE for graduate students.
Normal Distribution utilized in business settings The normal distribution has applications in many areas of business administration. For example: Modern portfolio theory commonly assumes that the returns of a diversified asset portfolio follow a normal distribution. In operations management, process variations often are normally distributed. Human Resource management applies Normal Distribution to employee performance.
Normal Distribution utilized in government entities Government entities such as the FDA. It's widely recognized as being a grading system for tests such as the SAT and ACT in high school or GRE for graduate students.
Applications of Central Limit Theorem Statistical Application of CLT Practical Significance of CLT One of the most common applications of CLT is in election polls. To calculate the percentage of persons supporting a candidate which are seen on news as confidence intervals. If the distribution is not known or not normal, we consider the sample distribution to be normal according to CTL. As this method assume that the population given is normally distributed. This helps in analyzing data in methods like constructing confidence intervals. It is also used to measure the mean or average family income of a family in a particular region. To estimate the population mean more accurately, we can increase the samples taken from the population which will ultimately decrease the sample means deviation. To create a range of values which is likely to include the population mean, we can use the sample mean.
IMPORTANCE OF NORMAL DISTRIBUTION Many dependent variables are commonly assumed to be normally distributed in the population. if a variable is approximately normally distributed we can make inferences about values of that variable.