Understanding Numpy Arrays and Array Manipulation
Learn about Numpy arrays in Python, including creation, indexing, manipulation, and matrix algebraic functions. Explore array generation methods, array stacking, slicing, and important array manipulation functions. Discover how to apply functions to arrays, import and save arrays from/to text files, and utilize matrix algebraic operations. Enhance your knowledge of array operations with helpful examples and visualization techniques using Matplotlib.

Download Presentation

Please find below an Image/Link to download the presentation.
The content on the website is provided AS IS for your information and personal use only. It may not be sold, licensed, or shared on other websites without obtaining consent from the author. If you encounter any issues during the download, it is possible that the publisher has removed the file from their server.
You are allowed to download the files provided on this website for personal or commercial use, subject to the condition that they are used lawfully. All files are the property of their respective owners.
The content on the website is provided AS IS for your information and personal use only. It may not be sold, licensed, or shared on other websites without obtaining consent from the author.
E N D
Presentation Transcript
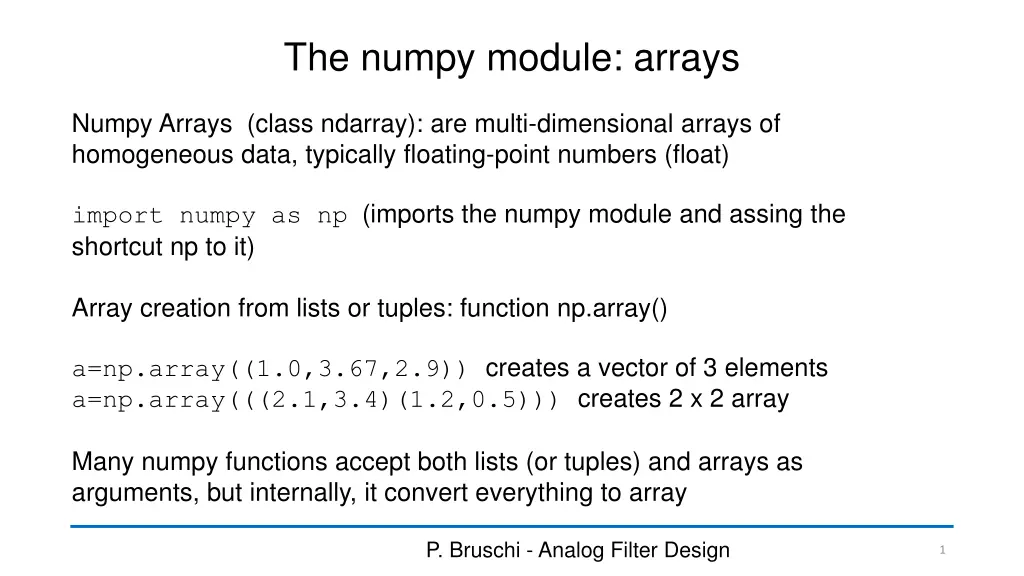
The numpy module: arrays Numpy Arrays (class ndarray): are multi-dimensional arrays of homogeneous data, typically floating-point numbers (float) import numpy as np (imports the numpy module and assing the shortcut np to it) Array creation from lists or tuples: function np.array() a=np.array((1.0,3.67,2.9)) creates a vector of 3 elements a=np.array(((2.1,3.4)(1.2,0.5))) creates 2 x 2 array Many numpy functions accept both lists (or tuples) and arrays as arguments, but internally, it convert everything to array P. Bruschi - Analog Filter Design 1
Array generation functions Creation of 1D array a=np.arange(start,stop,step) a=np.linspace(start, stop, num_points) a=np.logspace(first_dec,last_dec, num_point) Array importing and saving (from / to text files) A=np.genfromtxt( nome_file , ....) np.savetxt("name_file", array, ... ) It is possible to specify a data delimiter through an optional argument: delimiter= . Default is space. P. Bruschi - Analog Filter Design 2
Array indexing and manipulation Example: 2D array: a[k,h] (this notation does not work with lists) Application of functions to arrays: element by element Example np.sin(a) -> Returns an array by applying the sin() function to all the elements of a Array stacking. Example: A=np.array([[1,4],[-2.5,6]]); b=np.array([22,11]) 1 2.5 22 1 4 6 1 4 = A np.row_stack([A,b]) 5 . 2 6 11 22 4 22 = b np.column_stack([A,b]) 11 5 . 2 6 11 P. Bruschi - Analog Filter Design 3
Other important array manipulation functions Append a new value to an array: np.append(x,value) In 1D vectors, value can be a float (no need to be an array). x can be an empty array. Empty array: np.array([ ]) (useful to start a cycle where values are progressively appended to a vector) Array slicing syntax x[:5] all elements up to 5th(excluded, i.e., index 0,1,2,3,4) A[:,1] whole second column (index=1) of a 2D array y[x>0] y values for indices i such that x[i]>0. (x[x>0] is possible) P. Bruschi - Analog Filter Design 4
Matrix algebraic functions a.T (transposed of a) np.dot(a,b) (matrix product, if a and b are vectors, the scalar product is calculated) np.linalg.inv(a) calculates the inverse of a, if it exists Note: 1D arrays are not divided into column or row vectors. Thus, the transpose operation applied to a 1D arrays has no effect. P. Bruschi - Analog Filter Design 5
2D - Plotting functions import matplotlib.pyplot as plt plt.plot(a,b) # Linear plots plt.semilogx(a,b) # logarithmic X axis plt.semilogy(a,b) # logarithmic Y axis plt.loglog(a,b) # both axes are logarithmic Customizing Labels Fonts for all plots: Labelling: plt.plot(x,y, label= primo ) plt.plot(x1,y1, label= secondo ) plt.legend() plt.xlabel( X ) plt.label( Y ) import matplotlib as mpl mpl.rc('xtick', labelsize=16) mpl.rc('ytick', labelsize=16) mpl.rc("axes",labelsize=18) P. Bruschi - Analog Filter Design 6