Understanding Phylogenetic Confidence Limits
Explore the importance of confidence limits in phylogenies, the impact of sampling error, taxon sampling issues, and methods like bootstrap to estimate sampling error in phylogenetic analysis.

Download Presentation

Please find below an Image/Link to download the presentation.
The content on the website is provided AS IS for your information and personal use only. It may not be sold, licensed, or shared on other websites without obtaining consent from the author. If you encounter any issues during the download, it is possible that the publisher has removed the file from their server.
You are allowed to download the files provided on this website for personal or commercial use, subject to the condition that they are used lawfully. All files are the property of their respective owners.
The content on the website is provided AS IS for your information and personal use only. It may not be sold, licensed, or shared on other websites without obtaining consent from the author.
E N D
Presentation Transcript
Putting confidence limits on phylogenies
Most scientific measures are accompanied by some estimate of precision. For example.... 25 + 0.2 cms Phylogenies should also be accompanied by some indication of confidence limits One reason for a poor estimate is sampling error As a consequence, estimates of phylogeny based on samples will be accompanied by error.
The effect of sampling error can be seen by comparing the trees that result for different genes in the mitochondrion. Phylogenies for the same 6 mammals based on 15 different mitochondrial genes
Taxon sampling. Just as we may have limited samples of DNA so we may also have limited samples of taxa. In the mammalian example, only 6 taxa were used - a small fraction of the total number of extant mammals Inferred relationships among species can change if additional sequences are added For clades with a good fossil record, morphological data may prove superior to molecular data if the evidence from extinct taxa are crucial to recovering the phylogeny.
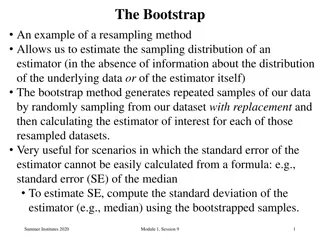
Estimating the sampling error using the non-parametric bootstrap A good way to measure sampling error is to take multiple samples from the popn. being studied and compare the estimates from the different samples. The spread of the estimates gives an indication of the sampling error. i.e. how much our conclusions would vary depending on the samples we took.
bootstrap contd... The n.p. bootstrap invokes the same underlying principal, but rather than re-sample replicates from the population we re- sample pseudoreplicates from the data. For each pseudoreplicate we derive an estimate of the parameter we are trying to measure (like mean height of population). The variation among the estimates derived from each pseudoreplicate provides a measure of the sampling error.
Comparison of methods for estimating sampling error of the estimate of population mean
The bootstrap can be applied to phylogenies Used to give us a feel for how good our inferred tree is Procedure: Generate pseudoreplicates from the sequences. by sampling columns at random w/ replacement until we have a new (fake) data set with the same number of sites as the original a a a a g g g g c t c t g g g g c c c c t t c c g t t t a a a a a g a g g a a a t c c t original data 2 0 1 0 2 0 3 0 1 1 1 t c c t a a a a a a a a c t c t c c c c c c c c g t t t g t t t g t t t a g a g g a a a pseudoreplicate 1
Bootstrap contd. Estimate the phylogeny for the pseudo-replicate data set t c c t a a a a a a a a c t c t c c c c c c c c g t t t g t t t g t t t a g a g g a a a pseudoreplicate 1 Repeat the process of generating pseudo replicates and estimating its tree a large number of times (100-10,000 times) This set of trees contains info. on the sampling error.
Because sampling is with replacement, some sites may occur more than once in the pseudoreplicate while others may not be represented at all. a a a a g g g g c t c t g g g g c c c c t t c c g t t t a a a a a g a g g a a a t c c t original data 2 0 1 0 2 0 3 0 1 1 1 t c c t a a a a a a a a c t c t c c c c c c c c g t t t g t t t g t t t a g a g g a a a pseudoreplicate 1 Each pseudoreplicate resembles original data in that it contains ONLY sites found in that data set, but differs in the frequency of the sites represented.
For 100 bootstrap replicates of a hominoid mtDNA data set, three topologies are obtained The split {orang,gibbon} {human,chimp, gorilla} occurs in all 100 bootstrap replicates (i.e. has 100% bootstrap support). However, there is a conflict between the relationships among the African apes {human,chimp, gorilla} This suggests these data lack the information to discriminate among the three hypotheses of relationship
Bootstrap consensus For small number of taxa, it is feasible to show the kinds of trees resulting from bootstrap replications For larger numbers of taxa we merely use a consensus tree to summarize the information collectively from each replicate D A E B C O 55 85 100 100
Parametric bootstrap Cross between a simulation and a bootstrap. Would like to know if the tree resulting from an analysis is erroneous due to an intrinsic bias in the data. Involves generating artificial data sets with a computer, but using the tree that was generated from the initial data with a particular model in mind.
Parametric bootstrap contd. Example: 18s rRNA subjected to parsimony analysis suggests birds and mammals are each others closest living relatives. Morphology and fossil data suggest this is incorrect. (Birds & Crocs sister-taxa w/ morphology) Possible reason for the conflict is long branch attraction between birds and mammals. Would like to know: If the traditional tree (bird-croc) is indeed correct, what are the chances that we could mistakenly conclude that the bird-mammal tree was best for these data? To test this, Huelsenbeck et al 1996 simulated the evolution of 18s on the 3 possible trees for 4 taxa to see how often the various tree-building methods recovered the correct tree.
Huelsenbeck et al 1996 Freq. of each tree recovered Assumed tree Estimated branch lengths and ts/tv ratio from original data when applied to each of the possible trees for 4 taxa Used the parameters they obtained to generate 1000 artificial data sets same size as original. Results show that no matter which topology the sequences were evolved on, tree 1 was recovered 85% of the time. So even if tree 3 is correct as suggested by morphology, the 18s data would likely support tree 1.