Understanding Probability: Basics and Applications
Learn the fundamentals of probability, from defining events to estimating probabilities with real-world examples. Understand key concepts like complementary events and experimental probabilities. Explore how to calculate the likelihood of events occurring in chance experiments.

Download Presentation

Please find below an Image/Link to download the presentation.
The content on the website is provided AS IS for your information and personal use only. It may not be sold, licensed, or shared on other websites without obtaining consent from the author. If you encounter any issues during the download, it is possible that the publisher has removed the file from their server.
You are allowed to download the files provided on this website for personal or commercial use, subject to the condition that they are used lawfully. All files are the property of their respective owners.
The content on the website is provided AS IS for your information and personal use only. It may not be sold, licensed, or shared on other websites without obtaining consent from the author.
E N D
Presentation Transcript
24 August 2025 Introduction to probabilities LO: Understand and use the vocabulary of probability. www.mathssupport.org www.mathssupport.org
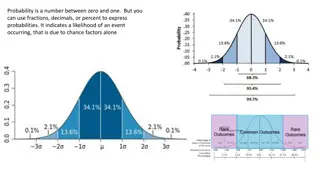
Introduction to probability The probability of an event is a measure of the chance that it will occur. Probabilities can be given as percentages from 0% to 100%, or decimal numbers between 0 and 1 or proper fractions. An impossible event has 0% chance of happening and is assigned the probability 0. A certain event has 100% chance of happening and is assigned the probability 1. An even chance event has 50% chance of happening and is assigned the probability 0.5. All other events are assigned a probability between 0 and 1. Slightly less than equal chance Slightly more than equal chance Very likely to happen Very unlikely to happen certain impossible 1 0 0.5 Equal chance of happening as not happening Not likely to happen likely to happen www.mathssupport.org www.mathssupport.org
Introduction to probability In probability we can use capital letters to represent events, for example The event that tomorrow Ahmed scores a goal in the next football match, we may call it the event A. The probability that the event A occurs is written P(A), which is the probability that Ahmed scores a goal. If P(A) = 0.25, what phrase describes this probability? Complementary events Two events are complementary if exactly one of they must occur. The probabilities of complementary events sum to 1 The complement of event A is denoted A . It is the event that A does not occur. www.mathssupport.org www.mathssupport.org
Introduction to probability For any event A with complementary event A , P(A) + P(A ) = 1 P(A ) = 1 P(A) If A is the event that Ahmed scores a goal in the next football match A is the event that Ahmed does not score a goal in the next football match P(A ) = 1 P(A) Therefore P(A ) = 1 0.25 P(A ) = 0.75 www.mathssupport.org www.mathssupport.org
How could you estimate the probability that a train will be late? Will the train be late today? You could keep a record of the number of times that the train arrives late over a period of 10 days, and then use these results to estimate the probability that it will be late in the future. The experiment here is observing the train, and the outcome you record is the train being late. The results enable you to find the experimental probability of the train being late. www.mathssupport.org www.mathssupport.org
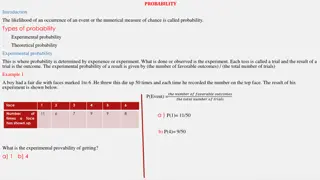
In experiments involving chance, we use the following terms to describe what we are doing and the results we are obtaining. Number of trials Is the total number of times the experiment is repeated. Outcomes are the different results possible for one trial of the experiment. Frequency of a particular outcome is the number of times that this outcome is observed. Relative frequency of an outcome is the frequency of that outcome expressed as a fraction or percentage of the total number of trials frequency Number of trials The experimental probability is the Relative frequency of the outcome Relative frequency = www.mathssupport.org www.mathssupport.org
A marketing company surveys 80 randomly selected people to discover what brand of shoe cleaner they use The results are shown in this table Relative frequency 0.3375 0.2750 0.2500 0.1375 Brand Frequency Shine Brite Cleano No Scuff 27 22 20 11 80 Based on these results, estimate the probability that a randomly selected person uses Brite We start by calculating the relative frequency of each brand frequency Number of trials= 27 80 Relative frequency = = 0.3375 www.mathssupport.org www.mathssupport.org
A marketing company surveys 80 randomly selected people to discover what brand of shoe cleaner they use The results are shown in this table Relative frequency 0.3375 0.2750 0.2500 0.1375 Brand Frequency Shine Brite Cleano No Scuff 27 22 20 11 80 Based on these results, estimate the probability that a randomly selected person uses Cleano From the table we know that the probability is 0.25 www.mathssupport.org www.mathssupport.org
A company manufactures items for computers. The number of faulty items is recorded in this table 0.1 0.09 0.082 Complete the table. Which is the best estimate of the probability of an item being faulty? The best estimate is the last result 0.082 Explain your answer. As the relative frequency is based on more results. www.mathssupport.org www.mathssupport.org
Expected value If there are n trial of an experiment, and the probability of an event occurring in each trial is p, then the expectation of the occurrence of that event is np. For example: How many times I expect to get a 2 if I roll a dice 120 times? n= 120 Expected value =120 1 6 p=1 = 20 6 We expect 20 times the dice lands in a 2 www.mathssupport.org www.mathssupport.org
Expected value In one week, 71 out of 627 trains were late to the station at Waterloo. In the next month, 2459 trains are scheduled to pass through the station. How many of these would you expect to be late?. n= 2459 71 627 Expected value =2459 71 627 p= We expect trains in the next month to be late. 278 www.mathssupport.org www.mathssupport.org
Sample space diagrams A sample space diagram is a way of showing all possible equally likely outcomes of an experiment. There are a variety of ways of representing sample spaces: Lists 2-dimensional grids Tree diagrams Tables of outcomes Venn diagrams www.mathssupport.org www.mathssupport.org
Listing outcomes Example: One coin is tossed and a die is rolled at the same time, list all the possible outcomes. We can write a list of all the possible outcomes in the experiment. H, 1 H, 2 H, 3 H, 4 H, 5 H, 6 T, 1 T, 2 T, 3 T, 4 T, 5 T, 6 www.mathssupport.org www.mathssupport.org
2-Dimensional grids Example: One coin is tossed and a die is rolled at the same time, list all the possible outcomes. A grid is often more efficient to show all the possible outcomes. Each point on the grid represents one of the outcomes T Coin H 2 3 4 Die 5 6 1 www.mathssupport.org www.mathssupport.org
Tree diagrams Example: One coin is tossed and a die is rolled at the same time, list all the possible outcomes. We can use a tree diagram to illustrate the sample space. 1 H T H T 2 H T H T 3 4 H T 5 H 6 T www.mathssupport.org www.mathssupport.org
Table of outcomes Example: One coin is tossed and a die is rolled at the same time, list all the possible outcomes. We can use a two-dimensional grid to write all the possible outcomes of the experiment. Die 3 H, 3 1 2 4 5 6 Coin H, 2 H, 4 H, 1 T, 1 H, 5 H T H, 6 T,6 T, 3 T, 4 T, 2 T, 5 www.mathssupport.org www.mathssupport.org
Sample space Example A red and a blue dice are rolled together. Calculate the probability that: The total score is 7 6 5 4 6 36 P(total score 7) = red dice 3 2 1 5 6 2 3 4 blue dice 1 www.mathssupport.org www.mathssupport.org
Sample space Example A red and a blue dice are rolled together. Calculate the probability that: The same number comes up on both dice. 6 5 4 6 36 P(same number) = red dice 3 2 1 2 3 4 blue dice 6 1 5 www.mathssupport.org www.mathssupport.org
Sample space Example A red and a blue dice are rolled together. Calculate the probability that: The difference between the scores is 1. 6 5 4 P(the difference between the scores is 1) = red dice 10 36 3 2 1 2 3 4 blue dice 6 1 5 www.mathssupport.org www.mathssupport.org
Sample space Example A red and a blue dice are rolled together. Calculate the probability that: The score on the red dice is less than the score on the blue dice. 6 P(the score on the red dice is less than the score on the blue dice ) = 5 4 red dice 15 36 3 2 1 2 3 4 blue dice 6 1 5 www.mathssupport.org www.mathssupport.org
Sample space Example A red and a blue dice are rolled together. Calculate the probability that: The total score is a prime number. 6 P(the total score is a prime number) = 5 4 15 36 red dice 3 2 1 2 3 4 blue dice 6 1 5 www.mathssupport.org www.mathssupport.org
Thank you for using resources from A close up of a cage Description automatically generated For more resources visit our website https://www.mathssupport.org If you have a special request, drop us an email info@mathssupport.org www.mathssupport.org www.mathssupport.org