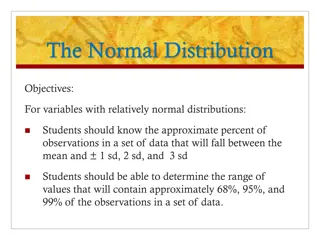
Understanding Probability Distribution Functions
Learn about Probability Density Functions, Cumulative Distribution Functions, Estimation, and Variance in this comprehensive guide. Explore examples, tips, and techniques for analyzing data types and distributions.

Download Presentation

Please find below an Image/Link to download the presentation.
The content on the website is provided AS IS for your information and personal use only. It may not be sold, licensed, or shared on other websites without obtaining consent from the author. If you encounter any issues during the download, it is possible that the publisher has removed the file from their server.
You are allowed to download the files provided on this website for personal or commercial use, subject to the condition that they are used lawfully. All files are the property of their respective owners.
The content on the website is provided AS IS for your information and personal use only. It may not be sold, licensed, or shared on other websites without obtaining consent from the author.
E N D
Presentation Transcript
Normal Distribution ristu.saptono@staff.uns.ac.id
Outline Probability Density Function and Cumulative Distribution Function Estimation and Variance Data type and distribution
Tips: Data Tips: Data Mentah Mentah >> >> Frekuensi Frekuensi Misal soal terdapat data mentah sebagaimana berikut 46, 46, 41, 44, 51, 54, 56, 57, 61, 63, 66, 67,70, 64, 57, 58, 60, 54, 55, 55, 57, 57, 57, 48,50 Maka buatlah tally card pada table di samping 0 1 2 3 4 5 6 7 8 9 4 I I II I 5 I I II II I IIII I 6 I I I I I I 7 I 0 1 2 3 4 5 6 7 8 9 4 1 1 2 1 5 1 1 2 2 1 5 1 6 1 1 1 1 1 1 7 1
Probability Density (Mass) Function Probability Density (Mass) Function PDF 0 1 2 3 4 5 6 7 8 9 ? ? = ? ? = ? =? ? 4 I I II I 5 I I II II I IIII I ? 6 I I I I I I 7 I 0 25= 0 1 25= 0.04 2 25= 0.08 5 25= 0.2 ? 40 = ? ? = 40 = 0 1 2 3 4 5 6 7 8 9 ? 41 = ? ? = 41 = 4 1 1 2 1 5 1 1 2 2 1 5 1 ? 54 = ? ? = 52 = 6 1 1 1 1 1 1 ? 57 = ? ? = 57 = 7 1
Cumulative Distribution Function Cumulative Distribution Function CDF 0 1 2 3 4 5 6 7 8 9 ??? = ?(? ?) 4 I I II I 5 I I II II I IIII I 6 I I I I I I ??48 = ? ? 48 = ? 40 + ? 41 + + ? 48 = 5 25= 0.2 ??50 = ? ? 50 = ? 40 + ? 41 + + ? 50 = 6 25= 0.24 7 I 0 1 2 3 4 5 6 7 8 9 4 1 1 2 1 5 1 1 2 2 1 5 1 6 1 1 1 1 1 1 7 1
Estimation Estimation ? ? = ????(??) 0 1 2 3 4 5 6 7 8 9 4 1 1 2 1 5 1 1 2 2 1 5 1 ? ? = .04 41 + .04 44 + + .04 70 = ? 6 1 1 1 1 1 1 7 1 0 1 2 3 4 5 6 7 8 9 .04 .04 .08 .04 4 .04 .04 .08 .08 .04 0.2 .04 5 .04 .04 .04 .04 .04 .04 6 .04 7
Variance Variance 2? ?? 0 1 2 3 4 5 6 7 8 9 ??? ? = ??? ? ? 4 1 1 2 1 5 1 1 2 2 1 5 1 6 1 1 1 1 1 1 ??? ? = ? 7 1 0 1 2 3 4 5 6 7 8 9 .04 .04 .08 .04 4 .04 .04 .08 .08 .04 0.2 .04 5 .04 .04 .04 .04 .04 .04 6 .04 7
Estimation and Variance Rule Estimation ? ?? = ? ? ?1+ ?2 = ? ?1 + ? ?2 ? ???+ ? = ?? ?? + ? Variance ??? ?? = ?2 ??? ?1+ ?2 = ??? ?1 + ??? ?2 ??? ???+ ? = ?2??? ??
Data Type Continuous Discrete Binomial Ordinal Scale/Count
Data Type Continuous Tinggi badan Berat badan Discrete Banyaknya mahasiswa laki-laki Banyak mahasiswa Perempuan Race Warna rambut
Distribution Properties Continuous Probability Density Function (PDF) ?(?), ?(?) Cumulative Distribution Function (CDF) ? ? < ? , ?(?) Estimation of element ?(?) Variance ???(?) Discrete Probability Mass Function (PMF) ?(?), ?(?) Cumulative Distribution Function (CDF) ? ? < ? , ?(?) Estimation of element ?(?) Variance ???(?)
Main Distribution Continuous Gaussian/Normal Inverse Gauss Gamma Discrete Binomial Poisson Negative Binomial
Normal Distribution Probability Density Function 2 1 ? (2?)? 1 ? ? ? ? ? = 2 Estimation ? ? = =? Variance ??? ? = ?2=?
The Bell Curve is Born (1769) De Moivre Bernoulli De Morgan
A Modern Normal Curve ?(?,?) ? ? Remember: unimodal, symmetric
Central Limit Theorem As the sample size increases, the shape of the distribution becomes more like the normal curve Can you think of variables that might be normally distributed? Think about it: Can nominal (categorical) variables be normally distributed?
Standardize ?(?,?) ?(0,1)
Translation ? ? ? + ?
Change of shape ?2 ? ? ? + ?
Standardize from ? to ? ? ? 1 ? ? 0
Standardization Find the ? value of ? ? =? ?(?) ??? ? In normal distribution ? =? ? ?
Standardize the following data: Standardize the following data: Misal soal terdapat data mentah sebagaimana berikut 46, 46, 41, 44, 51, 54, 56, 57, 61, 63, 66, 67,70, 64, 57, 58, 60, 54, 55, 55, 57, 57, 57, 48,50 0 1 2 3 4 5 6 7 8 9 4 I I II I 5 I I II II I IIII I 6 I I I I I I 7 I 0 1 2 3 4 5 6 7 8 9 4 1 1 2 1 5 1 1 2 2 1 5 1 6 1 1 1 1 1 1 7 1


 Function")


")


")