Understanding Sampling Distributions and Probability Distributions
Explore the concepts of sampling distributions, uniform distribution, exponential distribution, and other continuous random variables. Learn how to recognize different distributions, calculate probabilities, means, and standard deviations, and understand the applications of each distribution in various fields.

Download Presentation

Please find below an Image/Link to download the presentation.
The content on the website is provided AS IS for your information and personal use only. It may not be sold, licensed, or shared on other websites without obtaining consent from the author. If you encounter any issues during the download, it is possible that the publisher has removed the file from their server.
You are allowed to download the files provided on this website for personal or commercial use, subject to the condition that they are used lawfully. All files are the property of their respective owners.
The content on the website is provided AS IS for your information and personal use only. It may not be sold, licensed, or shared on other websites without obtaining consent from the author.
E N D
Presentation Transcript
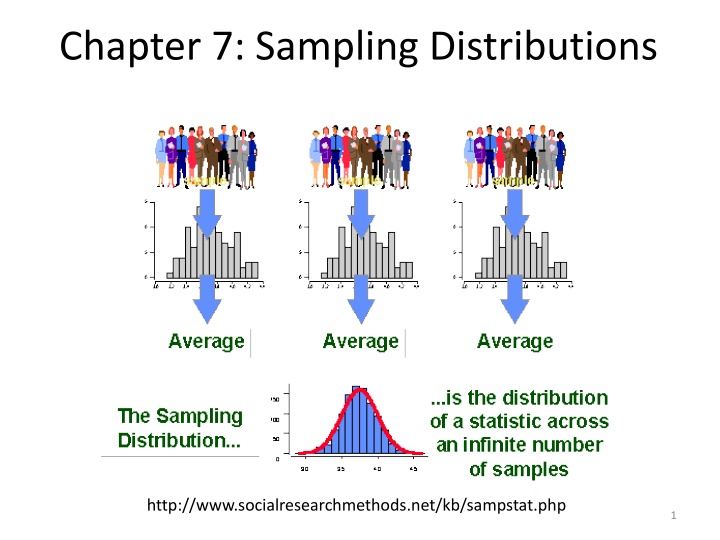
Chapter 7: Sampling Distributions http://www.socialresearchmethods.net/kb/sampstat.php 1
6.4: The Exponential Distribution (and Uniform Distribution) - Goals Be able to recognize situations that may be described by uniform or exponential distributions. Be able to recognize the sketches of the pdfs for uniform and exponential distribution. Calculate the probability, mean and standard deviation when X has a uniform or exponential distribution. 2
Uniform Distribution In a (continuous) uniform distribution, the probability density is distributed evenly between two points. 3
Uniform Distribution The density function of the uniform distribution over the interval [a,b] is 1 ? ? 0 ? ? =? + ? 2 ??=? ? 12 ? < ? < ? ? ? = ???? 4
Exponential Distribution Uses: amount of time until some specific event occurs (the amount of time between successive events) ? ? = ?? ?? ? 0 ???? 0 5
Exponential Distribution 0 ? < 0 ? 0 ? ? = 1 ? ?? ? ? =1 ? 1 ?2 Var ? = ??=1 ? 6
Gamma Distribution Generalization of the exponential function Uses probability theory theoretical statistics actuarial science operations research engineering 7
Beta Distribution This distribution is only defined on an interval standard beta is on the interval [0,1] uses modeling proportions percentages Probabilities Uniform distribution is a member of this family. 8
Other Continuous Random Variables Weibull exponential is a member of family uses: lifetimes lognormal log of the normal distribution uses: products of distributions Cauchy symmetrical, long straggly tails 9
7.1/7.2: Statistics, Parameters, Sampling Distribution of a Sample Mean - Goals Be able to differentiate between parameters and statistics. Explain the difference between the sampling distribution of x and the population distribution of . Determine the mean and standard deviation of x for an SRS of size n from a population with mean and standard deviation . Use the central limit theorem (CLT) to approximate the shape of the sampling distribution of x and use it to perform probability calculations. 10
Parameter and statistic A parameter is a numerical descriptive measure of a population. A statistic is any quantity computed from values in a sample. 12
Sampling Variability What would happen if we took many samples? Population Sample Sample Sample ? Sample Sample Sample Sample Sample A statistic is a random variable. 13
Sampling Distribution The sampling distribution of a statistic is the probability distribution of the statistic. 14
Sampling Distributions The sampling distribution of a statistic is the distribution of values taken by the statistic in all possible samples of the same size from the same population. The population distribution of a variable is the distribution of values of the variable among all individuals in the population. 15
Mean and Standard Deviation ? ?= ?? ? ?=?? ? 16
Shape of Sampling Distributions 1) If a population X ~ N( , 2) then the sample distribution of X ~ N ?,?2 ?. 2) Let X be the mean of observations in a random sample of size n drawn from a population with mean and finite variance 2. As the sample size n is large enough, then X ~N ?,?2 ?. 17
A Few More Facts Any linear combination of independent Normal random variables is also Normal. More generally, the distribution of a sum or average of many small random quantities is close to Normal whether independent or not. CLT also applies to discrete random variables. 18