Understanding Sampling Distributions and Sample Means
Explore the concept of sampling distributions, focusing on sample means and their calculation in relation to population distributions. Discover how the central limit theorem and normal distributions play a role in shaping the sampling distribution of sample means.

Download Presentation

Please find below an Image/Link to download the presentation.
The content on the website is provided AS IS for your information and personal use only. It may not be sold, licensed, or shared on other websites without obtaining consent from the author. If you encounter any issues during the download, it is possible that the publisher has removed the file from their server.
You are allowed to download the files provided on this website for personal or commercial use, subject to the condition that they are used lawfully. All files are the property of their respective owners.
The content on the website is provided AS IS for your information and personal use only. It may not be sold, licensed, or shared on other websites without obtaining consent from the author.
E N D
Presentation Transcript
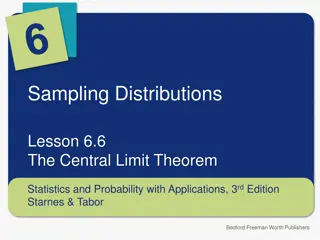
+ Chapter 7: Sampling Distributions Section 7.3 Sample Means
+Chapter 7 Sampling Distributions 7.1 What is a Sampling Distribution? 7.2 Sample Proportions 7.3 Sample Means
+Section 7.3 Sample Means Learning Objectives After this section, you should be able to FIND the mean and standard deviation of the sampling distribution of a sample mean CALCULATE probabilities involving a sample mean when the population distribution is Normal EXPLAIN how the shape of the sampling distribution of sample means is related to the shape of the population distribution APPLY the central limit theorem to help find probabilities involving a sample mean
Sample Means + Sample Means Sample proportions arise most often when we are interested in categorical variables. When we record quantitative variables we are interested in other statistics such as the median or mean or standard deviation of the variable. Sample means are among the most common statistics. Consider the mean household earnings for samples of size 100. Compare the population distribution on the left with the sampling distribution on the right. What do you notice about the shape, center, and spread of each?
x The Sampling Distribution of + Sample Means When we choose many SRSs from a population, the sampling distribution of the sample mean is centered at the population mean and is less spread out than the population distribution. Here are the facts. Mean and Standard Deviation of the Sampling Distribution of Sample Means Suppose that x is the mean of an SRS of size n drawn from a large population with mean and standard deviation . Then : The mean of the sampling distribution of x is x = The standard deviation of the sampling distribution of x is x = n as long as the 10% condition is satisfied: n (1/10)N. Note: These facts about the mean and standard deviation of nomatterwhatshapethepopulationdistributionhas. x are true
Sampling from a Normal Population + Sample Means We have described the mean and standard deviation of the sampling distribution of the sample mean x but not its shape. That's because the shape of the distribution of x depends on the shape of the population distribution. In one important case, there is a simple relationship between the two distributions. If the population distribution is Normal, then so is the sampling distribution of x . Thisistruenomatterwhatthesamplesizeis. Sampling Distribution of a Sample Mean from a Normal Population and standard deviation Suppose that a population is Normally distributed with mean . Then the sampling distribution of x has the Normal distribution with mean and standard deviation / n, provided that the 10% condition is met.
Example: Young Womens Heights Sample Means The height of young women follows a Normal distribution with mean = 64.5 inches and standard deviation = 2.5 inches. Find the probability that a randomly selected young woman is taller than 66.5 inches. Let X = the height of a randomly selected young woman. X is N(64.5, 2.5) z =66.5 64.5 2.5 P(X 66.5) = P(Z 0.80) =1 0.7881 =0.2119 =0.80 The probability of choosing a young woman at random whose height exceeds 66.5 inches is about 0.21. Find the probability that the mean height of an SRS of 10 young women exceeds 66.5 inches. Since the population distribution is Normal, the sampling distribution will follow an N(64.5, 0.79) distribution. For an SRS of 10 young women, the sampling distribution of their sample mean height will have a mean and standard deviation x = P(x 66.5) = P(Z 2.53) =1 0.9943 =0.0057 z =66.5 64.5 0.79 It is very unlikely (less than a 1% chance) that we would choose an SRS of 10 young women whose average height exceeds 66.5 inches. =2.53 n=2.5 x = =64.5 10=0.79
The Central Limit Theorem + Sample Means Most population distributions are not Normal. What is the shape of the sampling distribution of sample means when the population distribution isn t Normal? It is a remarkable fact that as the sample size increases, the distribution of sample means changes its shape: it looks less like that of the population and more like a Normal distribution! When the sample is large enough, the distribution of sample means is very close to Normal, no matter what shape the population distribution has, as long as the population has a finite standard deviation. Definition: Draw an SRS of size n from any population with mean and finite standard deviation . The central limit theorem (CLT) says that when n is large, the sampling distribution of the sample mean x is approximately Normal. Note: How large a sample size n is needed for the sampling distribution to be close to Normal depends on the shape of the population distribution. More observations are required if the population distribution is far from Normal.
The Central Limit Theorem + Sample Means Consider the strange population distribution from the Rice University sampling distribution applet. Describe the shape of the sampling distributions as n increases. What do you notice? Normal Condition for Sample Means If the population distribution is Normal, sampling distribution of x . This is true no matter what the sample size n is. then so is the If the population distribution is not Normal, limit theorem tells us that the sampling distribution of x will be approximately Normal in most cases if the central n 30.
Example: Servicing Air Conditioners Based on service records from the past year, the time (in hours) that a technician requires to complete preventative maintenance on an air conditioner follows the distribution that is strongly right-skewed, and whose most likely outcomes are close to 0. The mean time is = 1 hour and the standard deviation is = 1 Sample Means Your company will service an SRS of 70 air conditioners. You have budgeted 1.1 hours per unit. Will this be enough? Since the 10% condition is met (there are more than 10(70)=700 air conditioners in the population), the sampling distribution of the mean time spent working on the 70 units has x = n= The sampling distribution of the mean time spent working is approximately N(1, 0.12) since n = 70 30. We need to find P(mean time > 1.1 hours) 1 70=0.12 x = =1 P(x 1.1) = P(Z 0.83) =1 0.7967 =0.2033 z =1.1 1 0.12 =0.83 If you budget 1.1 hours per unit, there is a 20% chance the technicians will not complete the work within the budgeted time.
+Section 7.3 Sample Means Summary In this section, we learned that When we want information about the population mean we often take an SRS and use the sample mean parameter . The samplingdistribution of x describes how the statistic varies in all possible samples of the same size from the population. for some variable, x to estimate the unknown The mean of the sampling distribution is , so that x is an unbiased estimator of . x is / n for an SRS . This formula can be used The standard deviation of the sampling distribution of of size n if the population has standard deviation if the population is at least 10 times as large as the sample (10% condition).
+Section 7.3 Sample Means Summary In this section, we learned that Choose an SRS of size n from a population with mean and standard deviation . If the population is Normal, then so is the sampling distribution of the sample mean x . If the population distribtution is not Normal, the central limit theorem (CLT) states that when n is large, the sampling distribution of x is approximately Normal. We can use a Normal distribution to calculate approximate probabilities for events involving x whenever the Normal condition is met If the population distribution is Normal, : so is the sampling distribution of x . If n 30, the CLT tells us that the sampling distribution of approximately Normal in most cases. x will be