Understanding Sampling Methods and Biases in Statistics
Learn about representative populations, different types of sampling biases, and various sampling methods like judgmental sampling, voluntary sampling, and stratified random sampling. Discover how biases can impact the accuracy of research outcomes and understand the importance of selecting samples in a statistically significant way.

Download Presentation

Please find below an Image/Link to download the presentation.
The content on the website is provided AS IS for your information and personal use only. It may not be sold, licensed, or shared on other websites without obtaining consent from the author. If you encounter any issues during the download, it is possible that the publisher has removed the file from their server.
You are allowed to download the files provided on this website for personal or commercial use, subject to the condition that they are used lawfully. All files are the property of their respective owners.
The content on the website is provided AS IS for your information and personal use only. It may not be sold, licensed, or shared on other websites without obtaining consent from the author.
E N D
Presentation Transcript
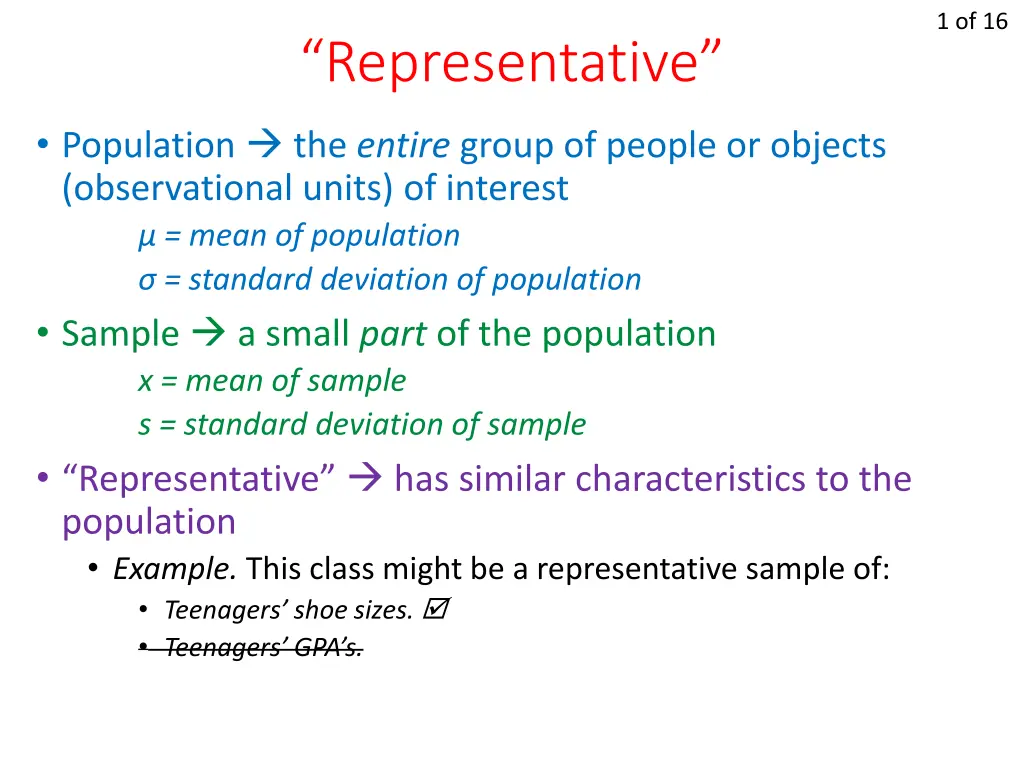
1 of 16 Representative Population the entire group of people or objects (observational units) of interest = mean of population = standard deviation of population Sample a small part of the population x = mean of sample s = standard deviation of sample Representative has similar characteristics to the population Example. This class might be a representative sample of: Teenagers shoe sizes. Teenagers GPA s.
2 of 16 Types of SAMPLING bias Selection (or undercoverage ) bias Some of population is excluded or underrepresented in selection Example: Population is teachers. Sample doesn t include math department. Nonresponse bias No data is collected from individuals who have been selected. Example: Mr. Colligan is given a survey, but he s too busy to fill it out. Response bias Process distorts responses Example: Study asks employees, Considering how hard you work, don t you think it s ridiculous that you don t get free sandwiches ever day?
3 of 18 Sampling methods
3 of 16 Judgment sample Individuals are chosen based on your judgment of who is representative of the population
4 of 16 Voluntary sample Individuals volunteer to be part of your sample.
5 of 16 Convenience sample Choose your sample based on what is convenient.
6 of 16 Simple random sampling (SRS) Most common, simple, effective Random: A sample chosen in such a way that every individual has an equal chance of being selected. Hat vs. Calculator MATH, PRB, randInt(min.,max.,#)
7 of 16 Systematic sampling Select an individual from the list at random After that, every kth individual is selected, where k(the skip ) is a predetermined interval Efficient and useful, as long as the population is homogenous (evenly distributed)
8 of 16 Stratified random sampling Divide the population into groups of individuals (called strata) Strata are similar in some way that is important for the response variable. Choose a SRS from each strata and combine. Effective if population is not homogenous
9 of 16 Cluster sampling Divide the population into groups (or clusters). Randomly select some of the clusters. All individuals in the chosen clusters are sampled. Very convenient, only with homogenous populations
10 of 16 Confounding( lurking , extraneous ) A confounding variable is an undesired 3rd variable that influences your treatment and response. Examples: Ice cream causes shark attacks. Larger pant sizes cause salary increases . Experiments control possible confounding variables To control means . 1. Keep consistent (ideal) 2. OR randomize (realistic) Example: Chocolate experiment. What did I control for?
11 Of 16 Common confounding variables Placebo effect Many subjects respond to any treatment, even fake ones Example: H. K. Beecher evaluated 15 clinical trials concerned with different diseases. 35% of 1,082 patients were satisfactorily relieved just by placebo (Beecher, 1955) SOLUTIONS: Control group a group of patients who receive no treatment. Compare results with treatment group(s) Blinding patients do not know which group they are in Experimenter bias Many experiments want their hypotheses to be confirmed SOLUTION: Double-blinding patients and experimenters do not know groups when giving treatments
12 of 16 Example A physical education instructor wants to compare the percentage of body fat for joggers, cyclists, and swimmers. She also wants to compare the percentage of body fat for vegetarians and meat-eaters. Let s assume you do an experiment. 1. What is the response variable(s)? 2. What is the factor(s)? What are its levels? 3. What are the treatments?
13 of 16 LEVELS FACTORS Run Swim Type of exercise Meat runner Meat swimmer Meat biker Bike Veggie runner Veggie swimmer Veggie biker Veggie Diet Meat Fattness
14 of 16 Blocking Confounding variables you DO know If you (reasonably) suspect a confounding variable, make everything have that characteristic equally, then randomize with your block(s) Examples: Does sunscreen prevent sunburn? Block of high-melanin, block of low-melanin. Among high-melanin, randomly assign sunscreen/no-sunscreen. Among low-melanin, randomly assign sunscreen/no-sunscreen. Do Cheerios lower cholesterol? Matched-pair design is most common blocking Each pair can be blocked for same age, sex, income, etc.
15 of 16 Let s say you have 28 people. 18 high-melanin 10 low-melanin Randomly assign Randomly assign 5 5 9 9 sunscreen no sunscreen sunscreen no sunscreen If people with darker skin wear sunscreen, do they burn less? If people with lighter skin wear sunscreen, do they burn less?
140 155 156 166 173 174 185 192 193 194 195 199 208 219 Example: Matched Pairs Let s say you have 28 people. You want to see if Cheerios lowers cholesterol, and you want to control for pre-existing cholesterol. You measure all participants cholesterol (mg/dL), then pair them up as close as possible. 220 220 221 228 244 248 249 249 251 259 261 268 269 278 140 155 156 166 173 174 185 192 193 194 195 199 208 219 220 220 221 228 244 248 249 249 251 259 261 268 269 278 Randomly assign one person in each pair to eat Cheerios. See if their cholesterol goes down more than their partner .