Understanding Sampling Variance and Determinants in Social Policy
Explore the concept of sampling variance, its determinants, and approaches to variance estimation in social policy research. Analyze total survey error, sampling methods, and subpopulation analysis while comparing point estimates for accurate data interpretation.

Download Presentation

Please find below an Image/Link to download the presentation.
The content on the website is provided AS IS for your information and personal use only. It may not be sold, licensed, or shared on other websites without obtaining consent from the author. If you encounter any issues during the download, it is possible that the publisher has removed the file from their server.
You are allowed to download the files provided on this website for personal or commercial use, subject to the condition that they are used lawfully. All files are the property of their respective owners.
The content on the website is provided AS IS for your information and personal use only. It may not be sold, licensed, or shared on other websites without obtaining consent from the author.
E N D
Presentation Transcript
Lecture 1: The sampling variance and its main determinants Tim Goedem Herman Deleeck Centre for Social Policy 18 January 2018 EUROMOD Winter School, University of Antwerp
Overview 1. Total survey error and the sampling variance 2. The sampling variance 3. The determinants of the sampling variance 4. Approaches to variance estimation 5. The ultimate cluster method 6. Analysing subpopulations 7. Comparing point estimates 8. Conclusion 2
Grooves et al., 2009, p. 39 3
Mode of data collection Grooves et al., 2009, p. 48 Computational error 4
Mode of data collection Grooves et al., 2009, p. 48 Computational error 5
Grooves et al., 2009, p. 48 6
Mode of data collection Mode of data collection Grooves et al., 2009, p. 48 Computational error 7
Mode of data collection Mode of data collection Grooves et al., 2009, p. 48 Computational error Computational error 9
1. Total survey error & sampling variance Bias vs. reliability Errors in observation Errors in non-observation Bias / validity Response / processing bias Coverage / Sampling / non- response / adjustment bias Reliability Response variance Adjustment variance /Sampling variance 10
Overview 1. Total survey error and the sampling variance 2. The sampling variance 3. The determinants of the sampling variance 4. Approaches to variance estimation 5. The ultimate cluster method 6. Analysing subpopulations 7. Comparing point estimates 8. Conclusion 11
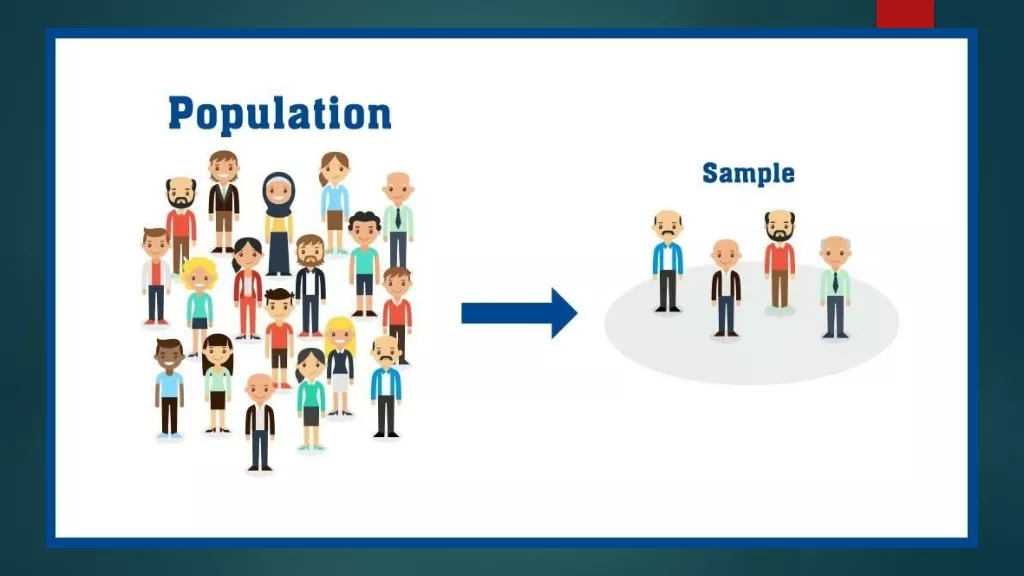
2. The sampling variance Statistics are a powerful tool - Need limited number of observations - Point estimate and estimate of precision However, without an estimate of its precision, a point estimate is pointless! 12
2. The sampling variance But rules must be followed: - Sample must be random: - every member of the population must have a non-zero probability of being selected in the sample, and for every member of the sample, this probability must be known - Precision must be correctly estimated 13
2. The sampling variance Common indicators of precision: - Sampling variance - (relative) standard error - Confidence interval - p-value Most often (but not necessarily) all indicators depend on estimate of sampling variance 14
2. The sampling variance Sampling variance = - variance of a survey statistic between independent, identical samples of the same population, i.e. the variance of a sampling distribution Standard error = (sampling variance)^0.5 In the absence of bias, the lower the variance, the more precise the point estimate will be 15
Grooves et al., 2009, p. 48 16
Overview 1. Total survey error and the sampling variance 2. The sampling variance 3. The determinants of the sampling variance 4. Approaches to variance estimation 5. The ultimate cluster method 6. Analysing subpopulations 7. Comparing point estimates 8. Conclusion 17
3. Determinants Determinants - Shape of population distribution + everything from drawing the sample to calculation and level of the point estimate Components: - Shape of population distribution - Sample design (incl. sample size) - Weighting - Data treatment: imputation & outliers - Characteristics of statistic of interest 18
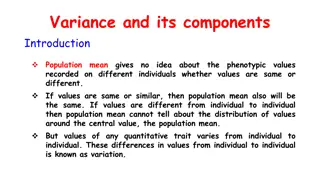
3. Determinants Distribution in the population The shape of the population distribution - The sampling variance of the mean is a function of the variance in the population - Population variance: - The sampling variance of the mean is equal to: For a simple random sample with replacement 19
3. Determinants Distribution in the population The shape of the population distribution - Variance in the population - Central Limit Theorem (in particular mean, proportion, sum of random variables) - Esp. for non-smooth indicators: mode(s), kurtosis, skewness, 20
3. Determinants Determinants - Shape of population distribution + everything from drawing the sample to calculation and level of the point estimate 5 big components: - Shape of population distribution - Sample design (incl. sample size) - Weighting - Imputation - Characteristics of statistic of interest 21
3. Determinants Sample design Sample design = sample selection procedure Must involve random selection Simple random sample 22
3. Determinants Sample design Complex samples - Stratification - Clustering - Multiple stages of selection (PSUs, SSUs, USUs) - (un)equal probabilities of selection 23
3. Determinants Sample design Stratification: - Divide population in non-intersecting groups (strata) - Independent sample in each stratum 24
3. Determinants Sample design 25
3. Determinants Sample design Stratification: - Increases precision (representativeness more assured) - Decreases sampling variance with between-stratum variance (for arithmetic mean) - Effect depends on sampling variance between strata - for the variable of interest => correlation between variables of interest and variables used to define strata => effect also depends on statistic of interest 26
3. Determinants Sample design Stratification: - To decrease sampling variance - To ensure a sufficiently large sample size of various subgroups in the population - If different parts of population require alternative sampling procedure - Effect on sampling variance depends on variable and statistic of interest - Effect is usually stronger in case of clustered sample 27
3. Determinants Sample design Clustering: - Within each stratum, divide elements in non- intersecting groups of elements - Randomly select groups (i.e. clusters ) 28
3. Determinants Sample design 29
3. Determinants Sample design Clustering: - Even though same sample size, clustering considerably increases variance, for a given n - In most cases decreases precision - Increase in sampling variance depends on Rho & cluster size - Rho=intraclass correlation coefficient, i.e. the degree of cluster homogeneity 30
3. Determinants Sample design Clustering: - For pragmatical reasons: Travel distance of interviewers If info on sampling frame is missing - For multilevel studies (e.g. education) 31
3. Determinants Sample design Multiple stages of selection: - First select primary sampling units (PSUs): clusters of elements - Strata at first stage = primary strata - Subsequently select smaller clusters within selected groups - Secondary sampling units (SSUs) - Ultimate sampling units (USUs) 32
3. Determinants Sample design 33
3. Determinants Sample design Special samples - 2-phase samples - Model-based samples - Non-probability samples 34
3. Determinants Sample design Types of selection: - With replacement - Without replacement (decrease in variance of n/N) - Systematic (special case) Probabilities of selection -> weighting - Equal - Unequal ( including PPS ) 35
3. Determinants Sample design and of course sample size Even though with clustered samples 36
3. Determinants Determinants - Shape of population distribution + everything from drawing the sample to calculation and level of the point estimate Components: - Shape of population distribution - Sample design (incl. sample size) - Weighting - Data treatment: imputation & outliers - Characteristics of statistic of interest 37
3. Determinants Weighting 3 basic steps in weighting: - Probability weighting Increase variance - Adjustment to unit non-response - Calibration Decreases variance 38
3. Determinants Weighting Variance in weights tends to increase sampling variance but depends on correlation structure of weights with variable of interest and how it interacts with increasing sample size in various parts of the distribution as well as statistic of interest 39
3. Determinants Data treatment Imputation - Item non-response - Different methods (random, non-random) - Special case: microsimulation studies - Neglect leads usually to under-estimation of variance - Easiest for researchers: multiple imputation 40
3. Determinants Data treatment Outlier treatment (e.g. top-bottom coding) - (Do not drop negative incomes or other unreliable observations) - LIS procedure: Bottom :1% of mean equivalised income (income>0) Top: 10 times non-equivalent median income (income>0) 41
3. Determinants Data treatment The evolution of FGT0 in the EU, with an EU-wide threshold, with and without LIS top-bottom coding, aggregate of 24 EU member states, EU- SILC 2005-2009 2005 2009 42
3. Determinants Data treatment The evolution of FGT1 in the EU, with an EU-wide threshold, with and without LIS top-bottom coding, aggregate of 24 EU member states, EU-SILC 2005-2009 2005 2009 43
3. Determinants Data treatment The evolution of FGT2 in the EU, with an EU-wide threshold, with and without LIS top- bottom coding, aggregate of 24 EU member states, EU-SILC 2005-2009 2005 2009 44
3. Determinants Determinants - Shape of population distribution + everything from drawing the sample to calculation and level of the point estimate Components: - Shape of population distribution - Sample design (incl. sample size) - Weighting - Data treatment: imputation & outliers - Characteristics of statistic of interest 45
3. Determinants Statistic of interest Most common: - Mean; total; proportion; ratio; regression coefficient; ... More complex: - When measure is based on sample estimate: e.g. % of population with income below 60% of the median income in the sample 46
3. Determinants Statistic of interest 47
3. Determinants Statistic of interest 48
3. Determinants Statistic of interest 49
3. Determinants Statistic of interest 50