Understanding Sexual Harassment on Public Transportation - Insights from WMATA Study
Discover insights from a 2018 study by Washington Metropolitan Area Transit Authority on sexual harassment incidents on public transportation. Explore findings on harassment incidence, victim reporting behaviors, and effective safety measures for Metro customers.

Download Presentation

Please find below an Image/Link to download the presentation.
The content on the website is provided AS IS for your information and personal use only. It may not be sold, licensed, or shared on other websites without obtaining consent from the author. If you encounter any issues during the download, it is possible that the publisher has removed the file from their server.
You are allowed to download the files provided on this website for personal or commercial use, subject to the condition that they are used lawfully. All files are the property of their respective owners.
The content on the website is provided AS IS for your information and personal use only. It may not be sold, licensed, or shared on other websites without obtaining consent from the author.
E N D
Presentation Transcript
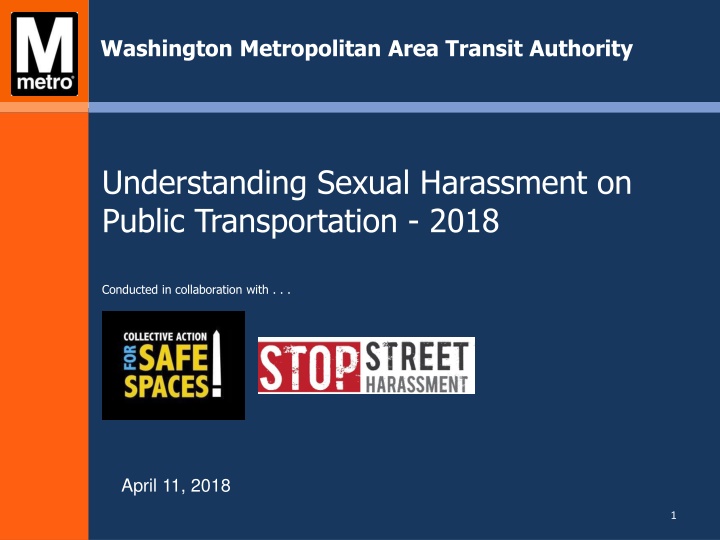
Washington Metropolitan Area Transit Authority Understanding Sexual Harassment on Public Transportation - 2018 Conducted in collaboration with . . . April 11, 2018 1
Background In March 2012 Metro began an aggressive, multi-layered campaign to combat sexual harassment, which included educational outreach to our customers, as well as enhanced ways for customers to report harassment incidents to police. In 2016, we first partnered with CASS and Stop Street Harassment to conduct a representative survey on Metropolitan DC area residents (including residents of DC, Maryland, and Virginia) that took measure of the following: Incidence rates of sexual or sexist harassment on Metro property Customer awareness of options for reporting harassment Familiarity with Metro s anti-harassment public service announcements How often victims of harassment report (or don t report) the incidents To inform Metro s ongoing efforts to combat harassment on its trains and buses, this 2018 survey further explores: The reasons why victims don t report harassment The reasons why witnesses don t report harassment or are reluctant to assist victims Effective ways to help Metro customers feel safe from harassment when riding Metro 2
Methodology This report presents the findings of a 1,000 person, regionally representative survey. Summary: Online-based survey in March 2018 Survey development benchmarked previously completed work in the industry Survey designed collaboratively between WMATA, SSH, and CASS Data were weighted to reflect age and jurisdictional distributions 3
Sexual Harassment Incidence by Place* Compact area residents experience similar levels of harassment compared to the nation. Sexual harassment on public transportation in the region is comparable to the nation as a whole, 21% vs. 17%** respectively. However, women (27%) are nearly twice as likely as men (14%) to experience harassment on public transportation. Store 17% Arena 11% 11% 8% 33% 21% *Multiple response question. Percentages may not add to 100. **Source: A National Study on Sexual Harassment & Assault. Stop Street Harassment. Feb. 2018 4
Sexual Harassment on Metro Property Approximately two-thirds (64%) of customers harassed on Metro, experienced it on board trains Three in five customers (58%) harassed on Metro, experienced it in Metrorail stations Two in five (40%) customers harassed on Metro, experienced it on board buses Two in five (39%) customers harassed on Metro, experienced it at a bus stop 5
Types of Sexual Harassment Experienced on Metro Property* Verbal harassment 64% Leering 42% Being rubbed up against in a sexual way 30% Following/stalking 24% Public exposure/flashing 21% Groping 21% Homophobic comments 19% Transphobic comments 17% Public masturbation 16% Sexual assault 14% Up-skirt photos 13% Other 1% 0% 10% 20% 30% 40% 50% 60% 70% *Multiple response question. Percentages may not add to 100. 6
Reporting of Harassment on Metro Property By Victims Has Increased Since 2016* 77% I have never reported the behavior or incident 50% Told station manager, bus operator, or other non-police staff member 16% 26% 11% Told Metro Transit Police Officer at the station 24% 2016 5% Called Metro Transit Police (202-962-2121) 2018 20% 0% Called 911 16% Submitted an incident report at wmata.com/harassment 6% 16% 1% Text "MyMTPD" from your phone 16% 2% Other 2% 0% 10% 20% 30% 40% 50% 60% 70% 80% 90% *Multiple response question. Percentages may not add to 100. 7
Reporting by Bystanders Who Witnessed Harassment on Metro Property*, 2018 53% I have never reported the behavior or incident Told station manager, bus operator, or other non-police staff member 19% 18% Told Metro Transit Police Officer at the station 16% Called Metro Transit Police (202-962-2121) 14% Called 911 11% Submitted an incident report at wmata.com/harassment 10% Text "MyMTPD" from your phone 4% Not sure/Don't remember 2% Other 0% 20% 40% 60% *Multiple response question. Percentages may not add to 100. 8
Metro Sexual Harassment Education Campaign Familiarity 47% Percentage of Metro customers familiar with the campaign. The more one rides the more familiar with the campaign. Familiar Victims aware of the campaign were nearly three times as likely to report an incident as those not aware. 9
Awareness of Metros Anti-Harassment Campaign Greatly Increases Reporting Rate of Harassment Reporting Rates Witnesses Victims Not Aware of Metro Campaign Aware of Metro Campaign Not Aware of Metro Campaign Aware of Metro Campaign 26% 72% 28% 63% 10